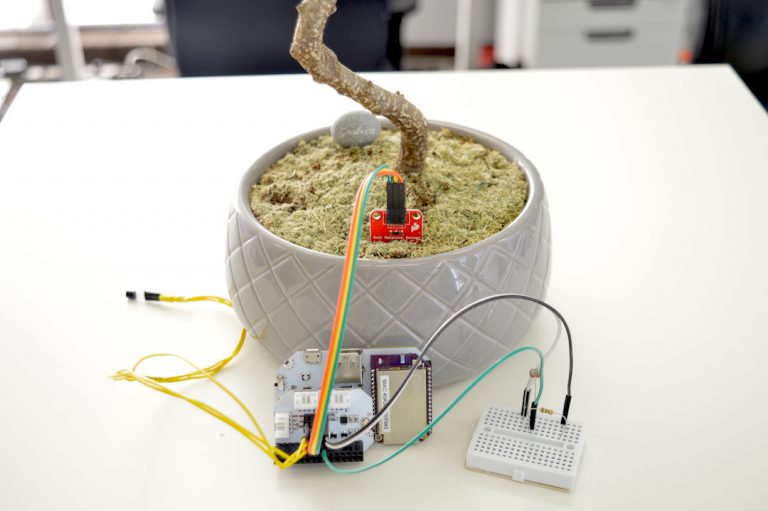
Follow along to learn how to build an IoT sensor using Python and the Omega2 ADC Expansion! We built our sensor to be able to track the baby tea tree we have in our office, but this IoT sensor setup is a great template for building your own IoT sensor and tracking data that’s important to you.
Ingredients
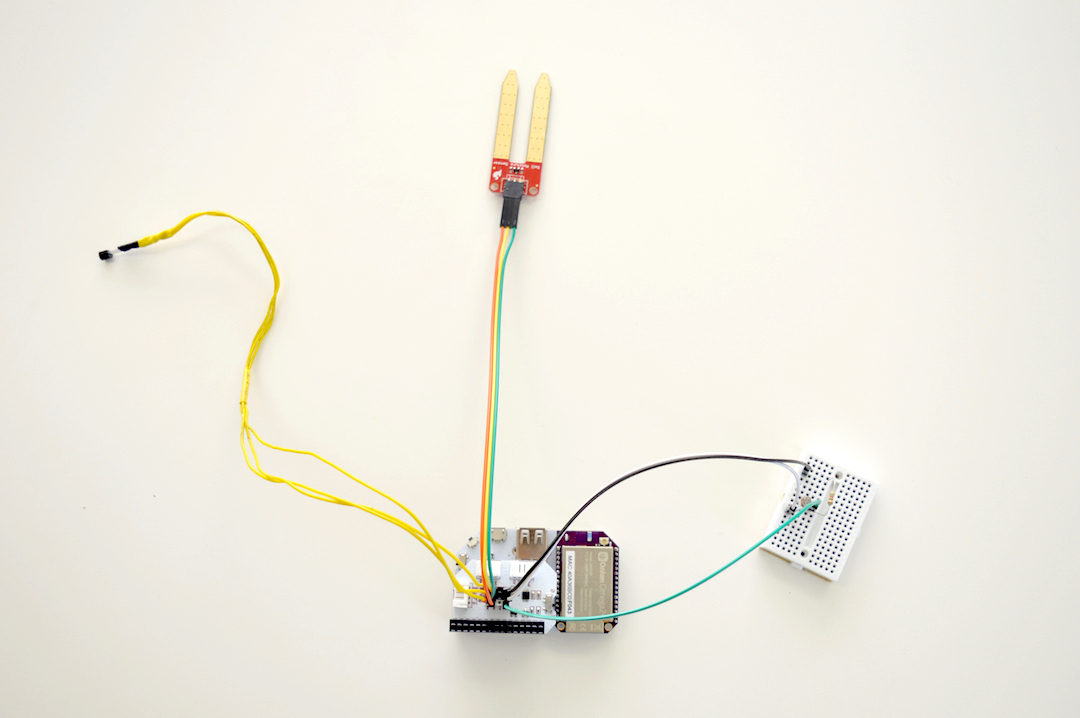
The IoT Computer components:
For our project we used the following sensors, but the ADC Expansion is flexible and supports many analog sensors:
- Temperature Sensor
- Soil Moisture Sensor
- Light Intensity Sensor
- Photoresistor
- 1kΩ resistor, a small breadboard, and some jumper wires
Physical Setup
The wiring with the ADC Expansion is very straight-forward: connect each sensor’s signal, power, and ground to the ADC Expansion. Each sensor should be connected to a different input channel on the ADC Expansion.
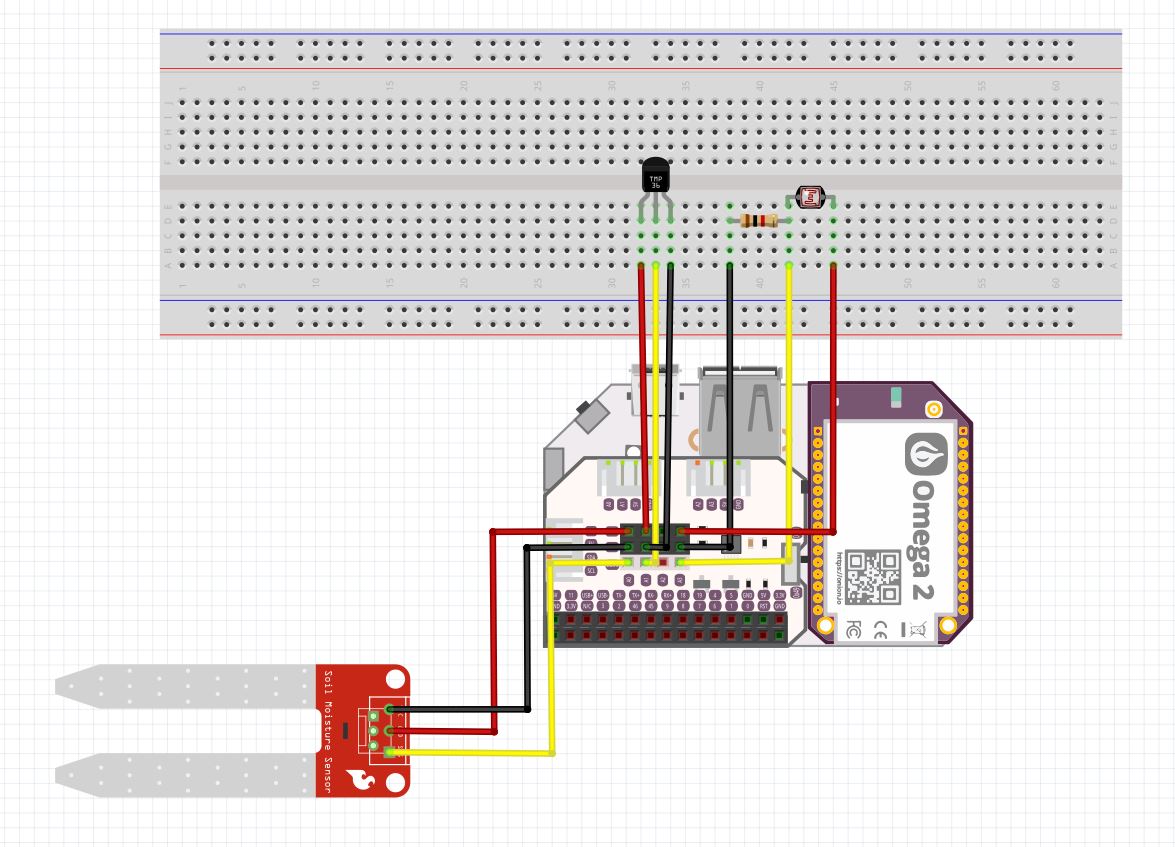
Since our light sensor is based on a photoresistor, we’ll need to make a voltage divider to sample the light intensity. See our guide on using a photoresistor for details.
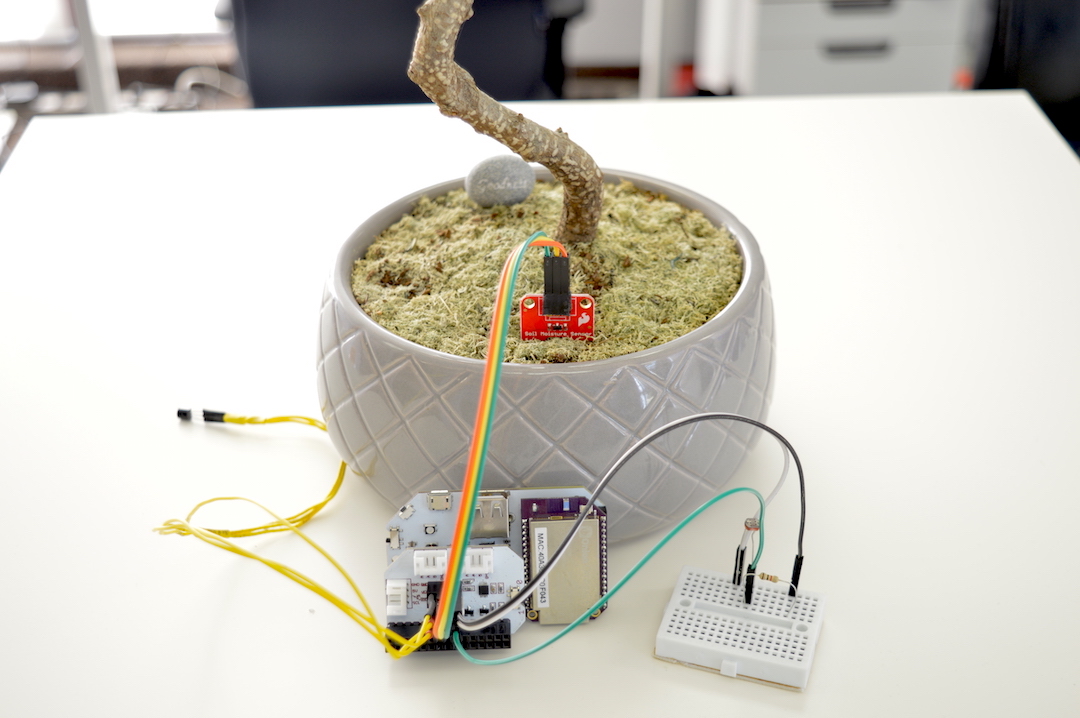
Position your IoT sensors so you can track the data you’re interested in. We wanted to be able to keep an eye on our office tea tree:
Install Python
Access your Omega’s command line, make sure you’re connected to the internet, and run the following:
opkg update
opkg install python-light python-adc-exp
The Python Program
The program will first instantiate an object to interact with the ADC Expansion, and then it will run an infinite loop that will read the voltage from each sensor, convert it to meaningful measurements for each sensor, and display the measurements.
Create a file iotSensor.py on your Omega and populate it with this code:
Running the Program
Let’s run the Python program by entering python iotSensor.py into the command line. You will see something like this:
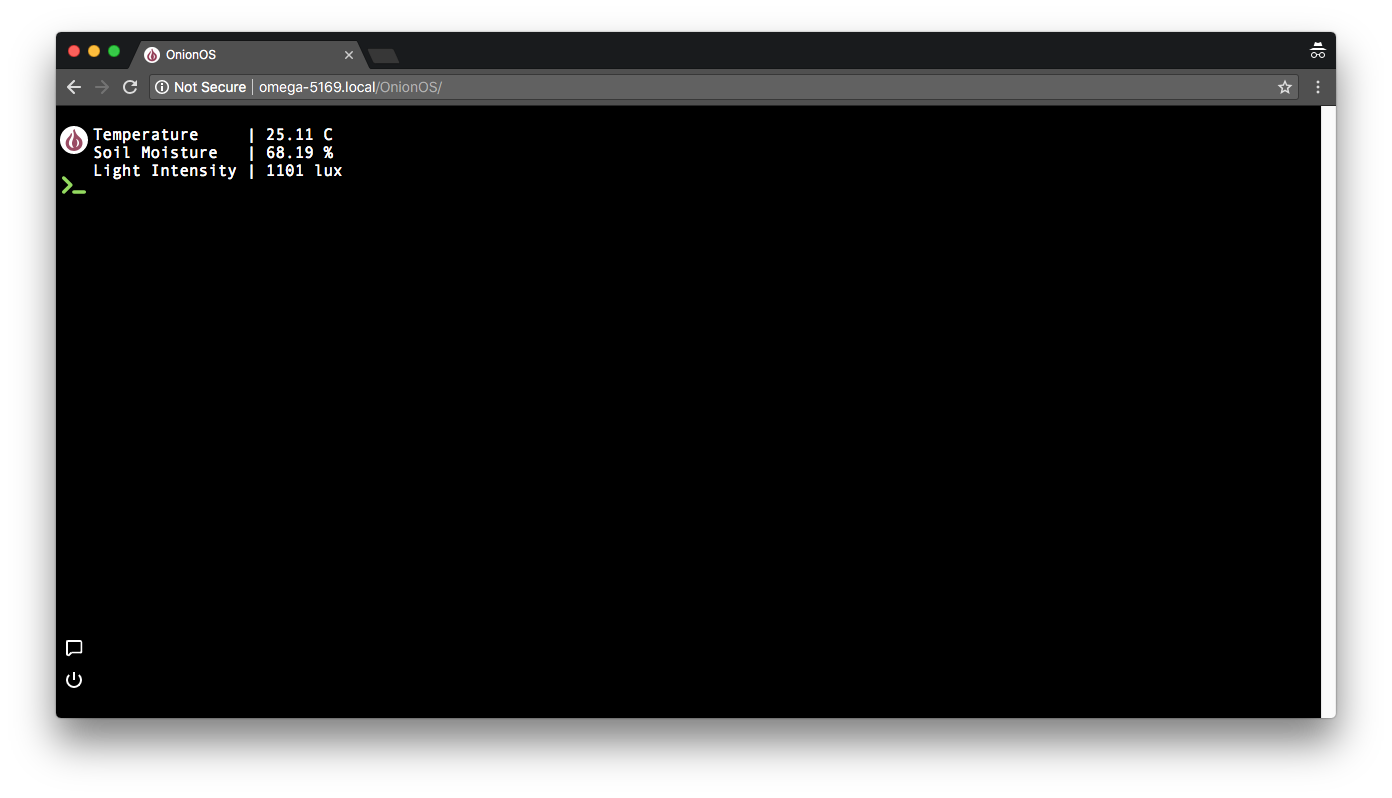
The sensor readings will update twice a second, providing sensor real-time data!
What’s Next
Now that you have your IoT sensor up and running, gathering real-time data, you can follow our guides to push datapoints to cloud services like AWS IoT, Losant, or IBM Watson IoT.
Once your data is in the cloud, you create dashboards to visualize the measurements or take actions based on the readings.
Happy Hacking!
