
Sensor Monitor – New OnionOS App
Collecting sensor data is an incredibly common IoT application, however, if that data is left in a JSON object or a CSV and is never interpreted, these collection efforts are wasted cycles. Our brains have powerful pattern matching capabilities and simply seeing data presented in a visual way allows us to quickly draw conclusions at a glance, without pouring over datapoints.
With that in mind, we’re excited to present the OnionOS Sensor Monitor App: Plot analog sensor readings in real time in your browser with OnionOS, the ADC Expansion, and the new Sensor Monitor app.
Installation
To install the Sensor Monitor App and update OnionOS on your Omega, run the following:
opkg update
opkg upgrade onion-os adc-exp
opkg install oos-app-sensor-monitor
We’re working on a more elegant app update solution, stay tuned!
The App
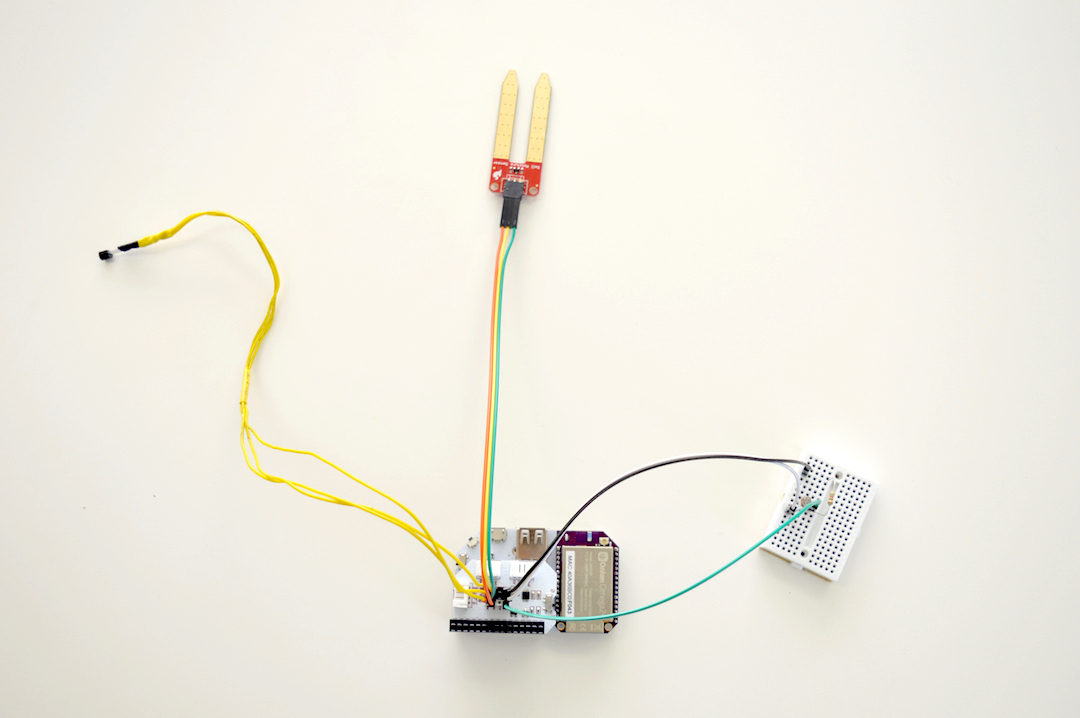
Before we get to visualizing our sensor data, we’ll first need to have sensor data to collect! You will need the following:
Wire up your analog sensors to the ADC Expansion on your Omega:
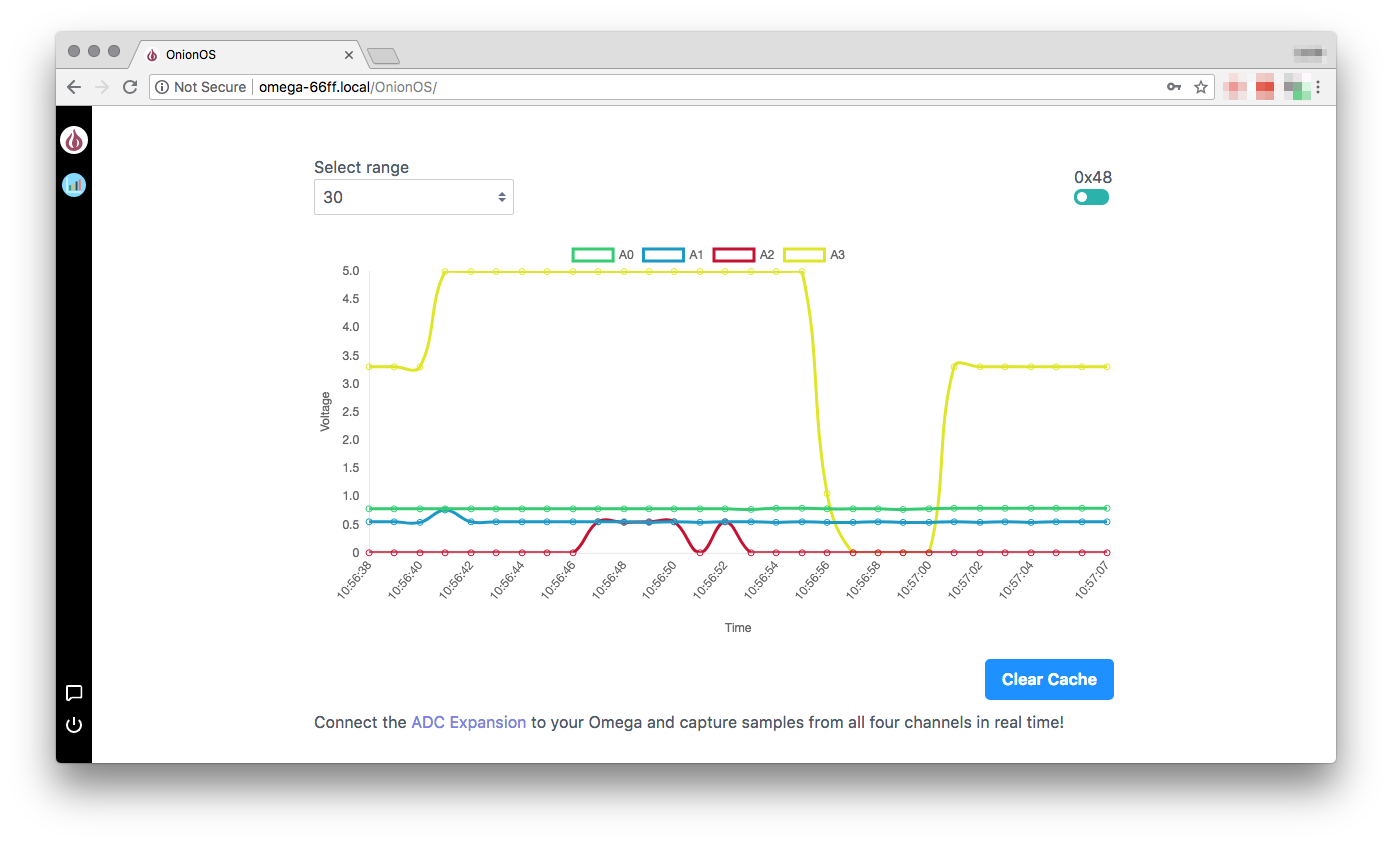
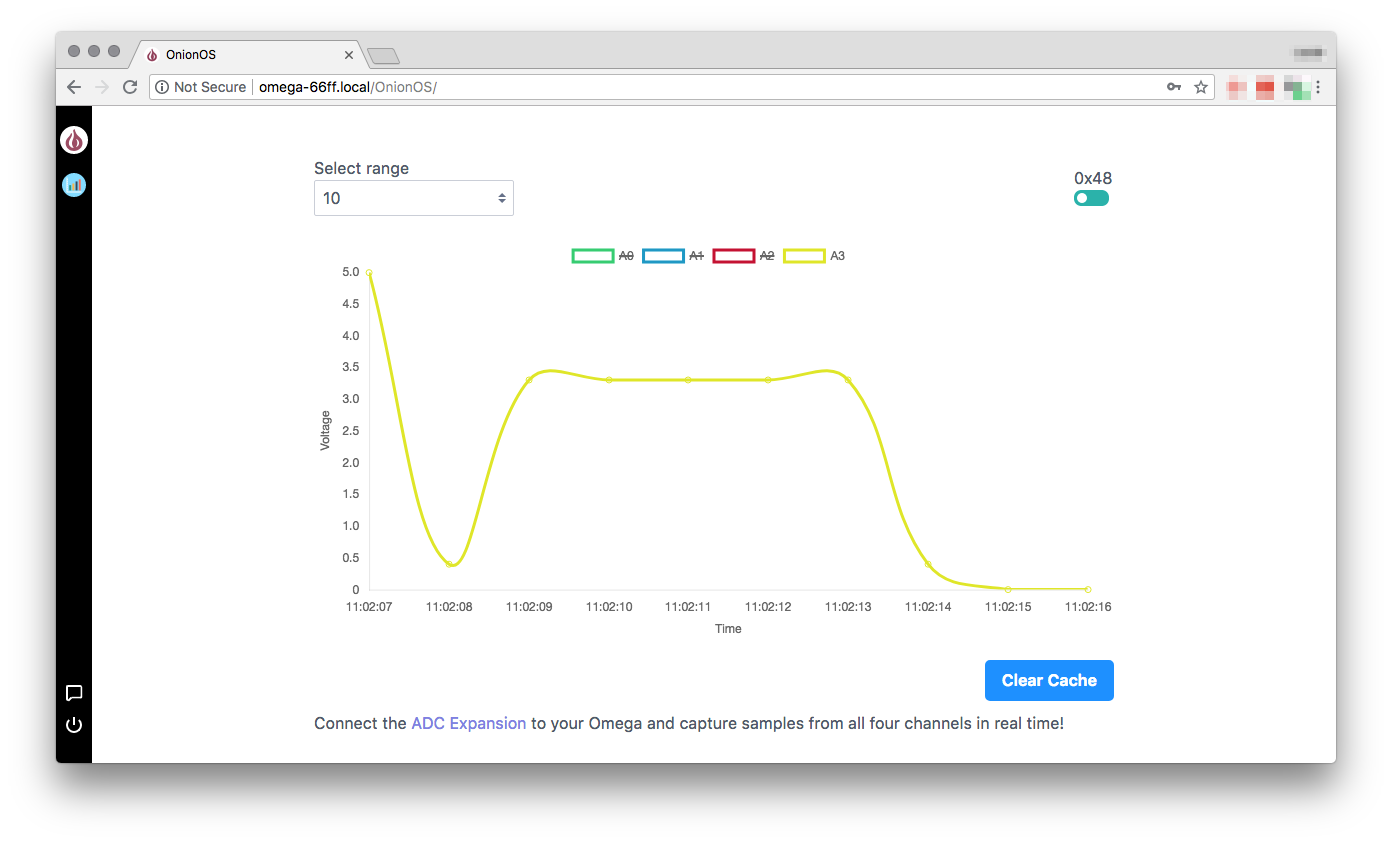
Then head over to OnionOS with your browser and open the Sensor Monitor app. It will automatically sample the analog voltages from your sensors once a second and plot the measurements:
OnionOS is hosted on your Omega and can be accessed by pointing a browser to the Omega’s web server at:
http://Omega-XXXX.local/where theXXXXare the last four digits from the your Omega’s sticker. Note that you’ll need to be on the same network as your Omega to access OnionOS.
Visualizing your Data
- Use the drop-down menu on the top-left to choose the time scale for the chart
- The slider on the top-right controls the ADC Expansion I2C device address, match this to the switch value on your ADC Expansion
- See only the signals you need: Clicking on a channel in the legend at the top of the chart will toggle that channel’s visibility in the chart
- And, best of all, your settings and the chart will be restored the next time the app is opened
- To clear the stored settings and chart, just hit the Clear Cache button on the bottom right
What’s Next
The next step will be to push data to the cloud. You can check out our tutorial on how to push data to various cloud services. You can freely use this project as a starting point for your own IoT Sensors!
Feedback
We would love to hear what you think about the Sensor Monitor app. Let us know in the Onion Community or Tweet @OnionIoT
Happy charting!