HI EVERYONE!
Welcome back to 2-Bullet Tuesday, where we’ll share useful tips and awesome stuff sent in by Omega2 users all around the world. Check out creative projects and tutorials that will supercharge your IoT development!
Omega Tip
Visualizing Sensor Data on AWS
Last week’s tip was all about setting up an Omega to periodically push temperature sensor data to AWS IoT. We figured, it’s no fun to look at just numbers, so this week’s tip is all about using AWS to visualize the incoming sensor data! To accomplish this, we’ll first create an ElasticSearch cluster to store and index the sensor data, then we’ll make an AWS IoT rule that will forward the sensor readings to our new ElasticSearch cluster, and finally, we’ll use Kibana to actually visualize the readings.
It may sound a little daunting, but all of these services are readily available on AWS and this tip will take you through the setup step-by-step!
The best part is that you can build on this week and last week’s tips to suit your own use-cases. Our goal is to show you how to configure everything, and then you can take it from there and add your own sensors and make whatever dashboards you’re interested in creating!
A small note before we proceed: AWS is a paid service and your usage may incur fees. Use at your own discretion!
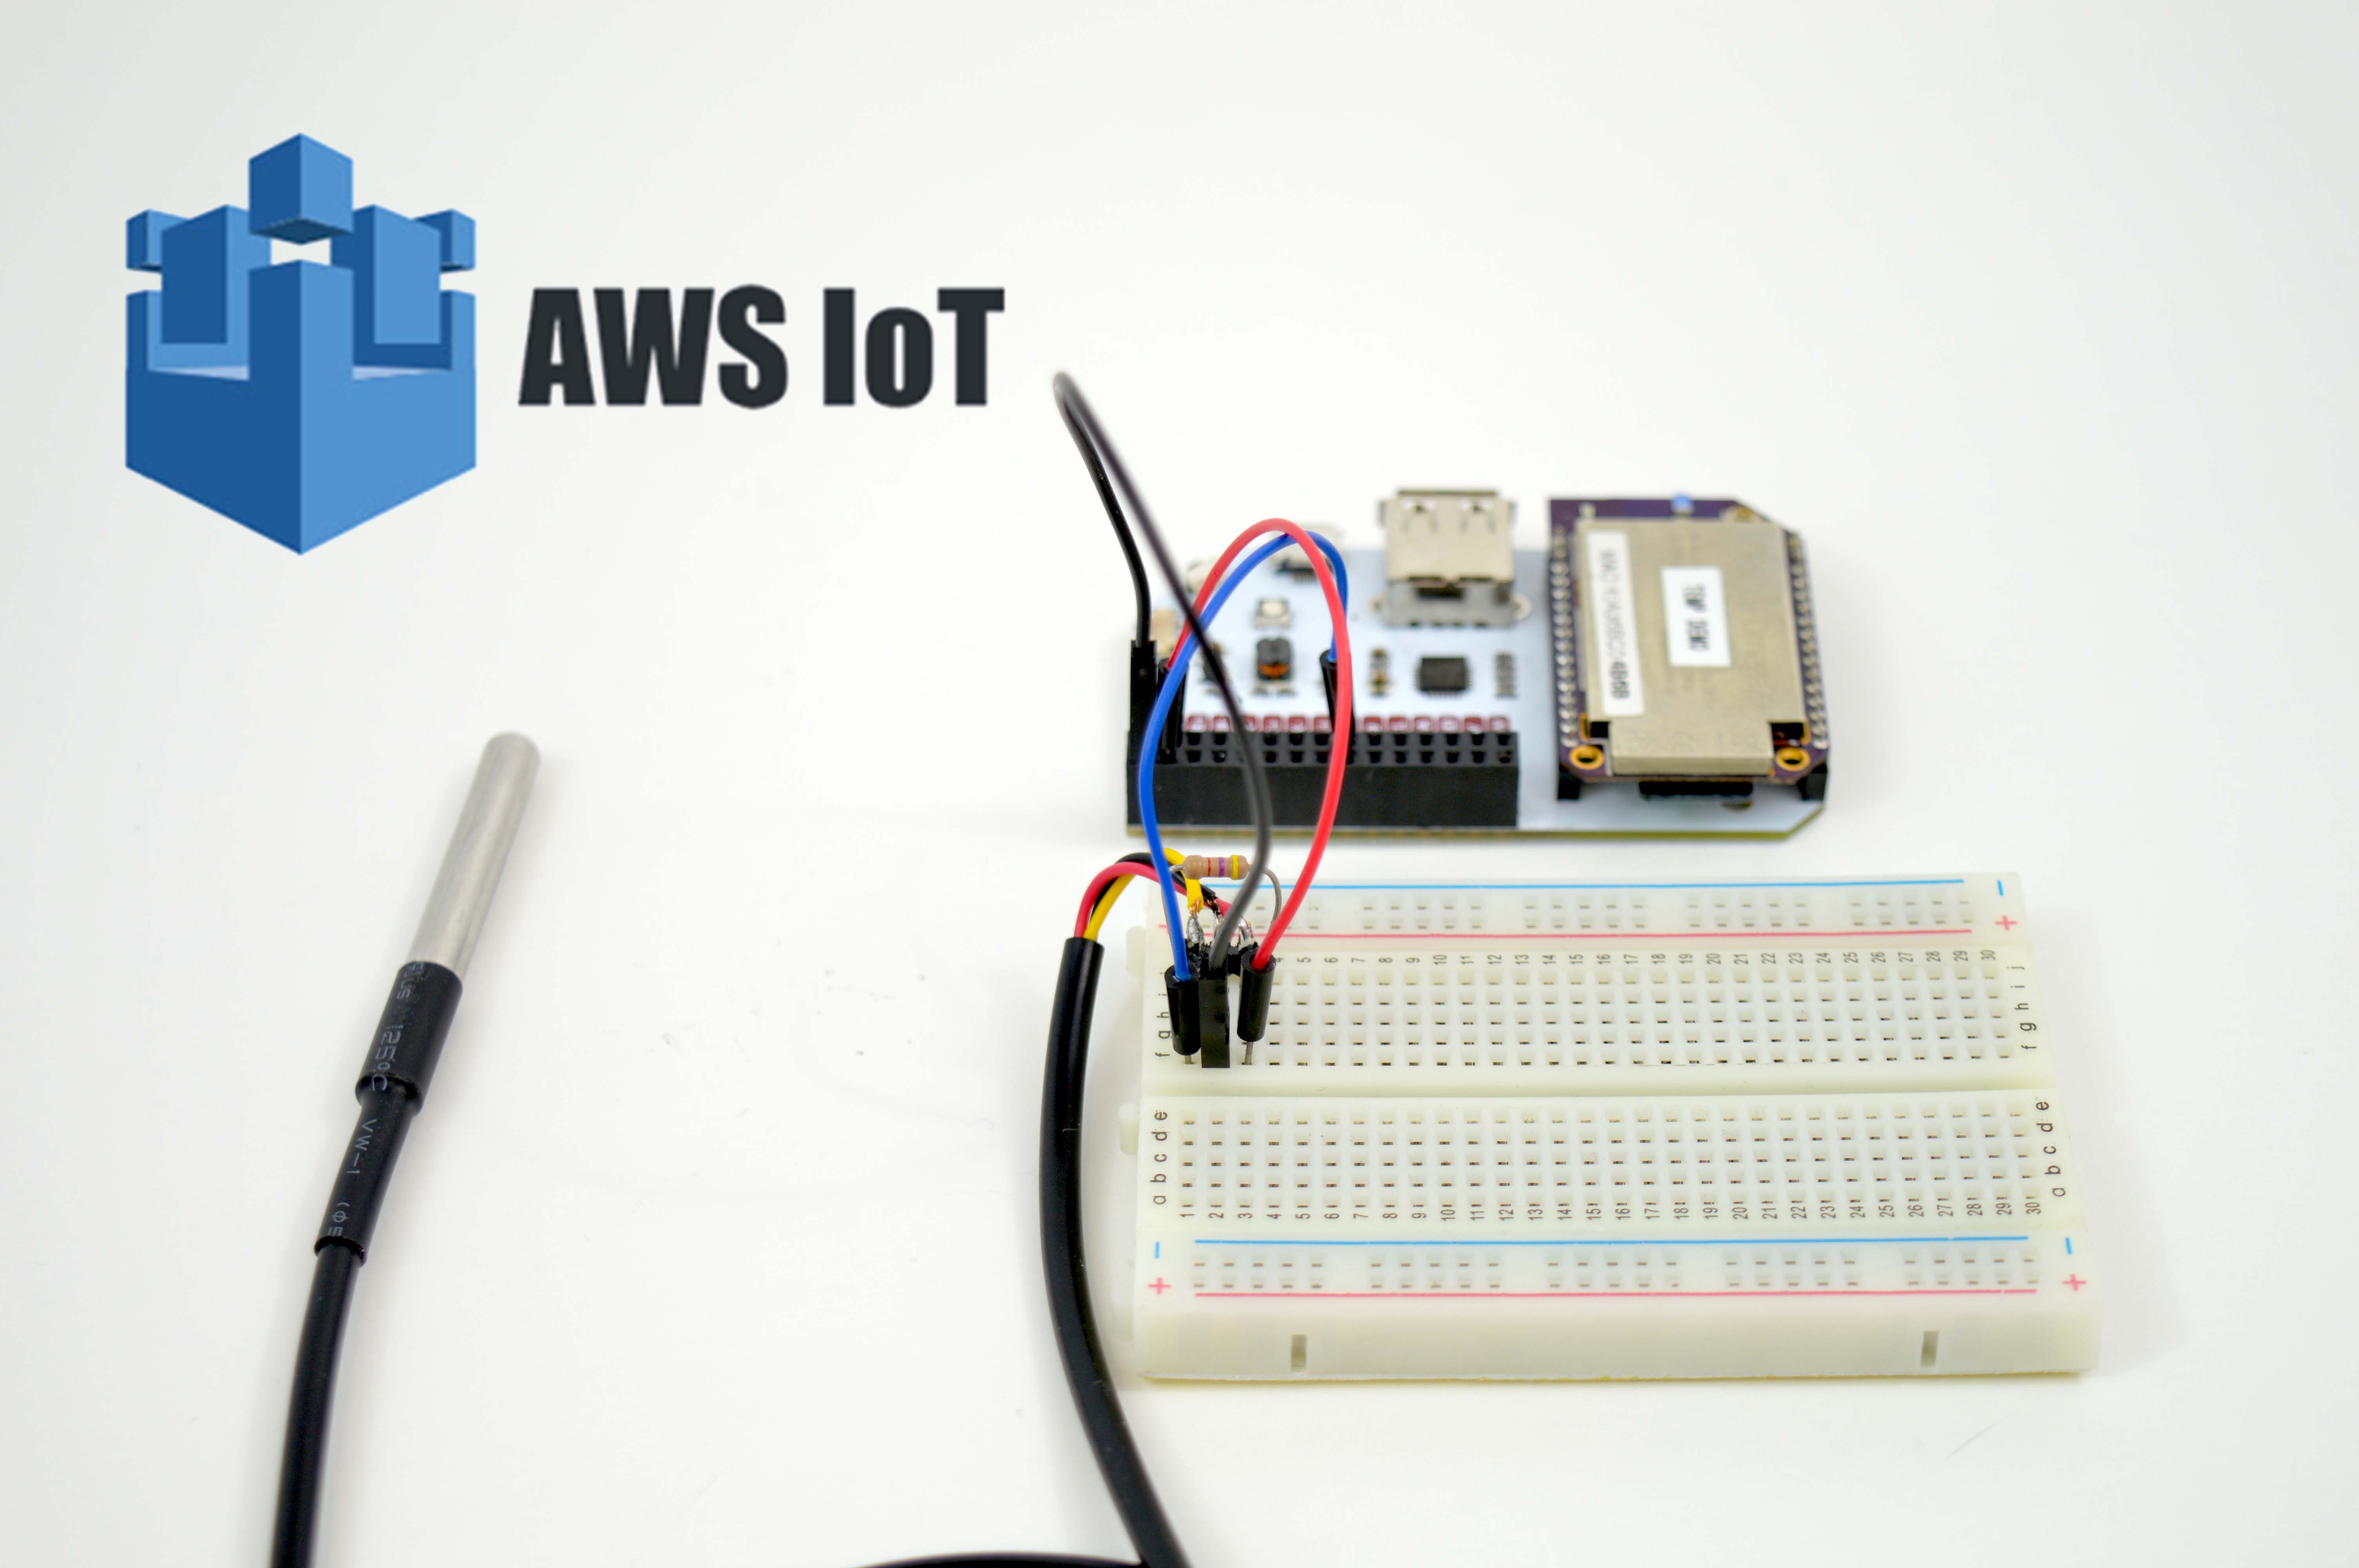
Pushing Sensor Data to AWS IoT
The very first step is having sensor data that can be visualized. To start, you’ll need to set up an Omega to automatically push sensor data to AWS IoT. Check out last week’s 2-Bullet Tuesday tip for detailed instructions. The guide focuses on using a temperature sensor, but it can be easily adapted to sensors of your choosing.
Creating an ElasticSearch Domain
We’ll use an ElasticSearch cluster to store and index the incoming sensor data. ElasticSearch is a really powerful tool, our use of it here is almost like a Hello World program. Definitely take a closer look at ElasticSearch if you’re curious. AWS has an ElasticSearch service that you can use to setup clusters without having to deal with the nitty-gritty.
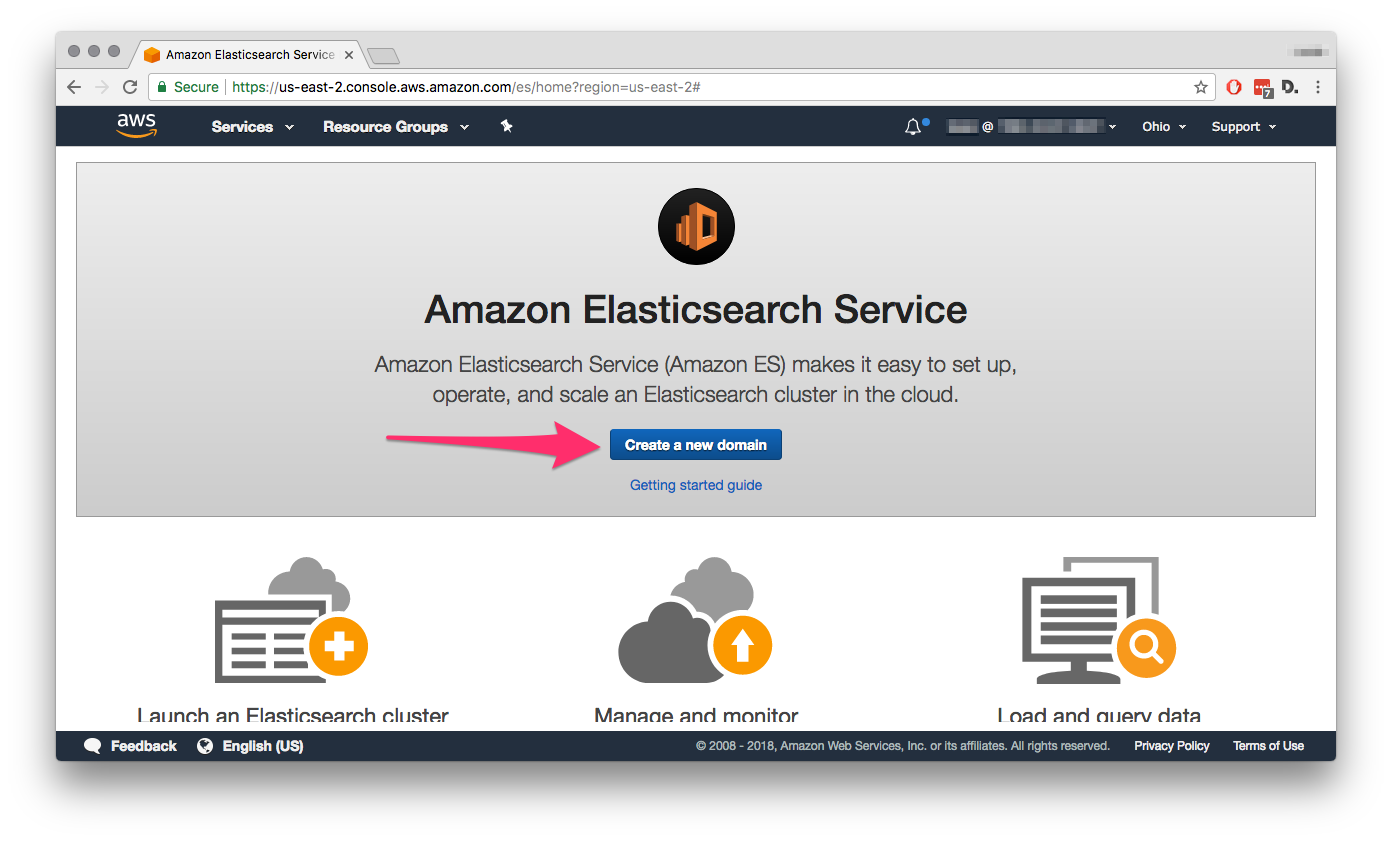
So, let’s log in to AWS and select the ElasticSearch service, then create a new domain:
You’ll need to give your domain a name, we’re following our streak of creative naming, and have decided to call our domain iot-dashboard:
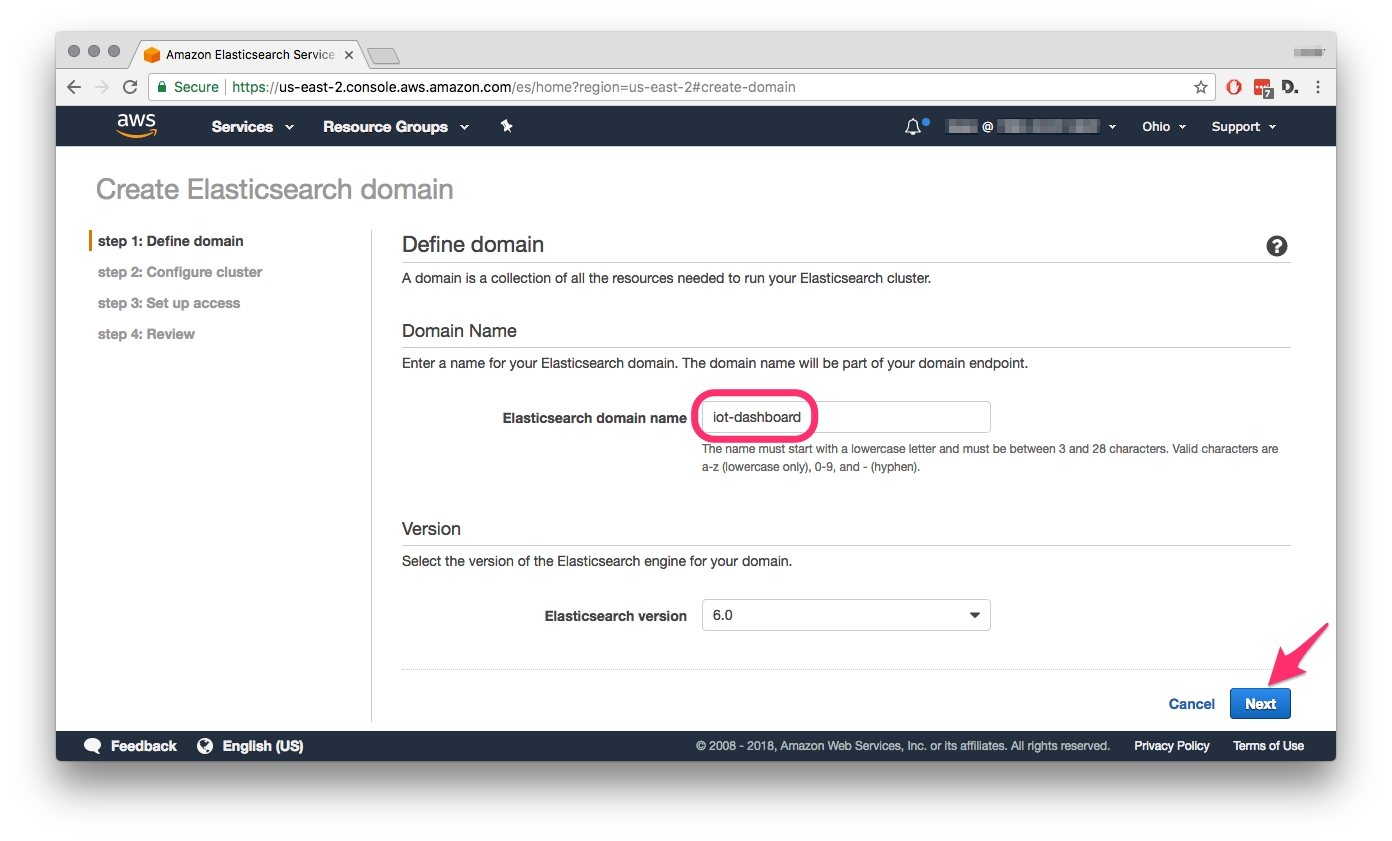
The next step is configuration of the ElasticSearch cluster itself. For our purposes, the default settings will do just fine. Scroll to the bottom and hit Next.
Next, we’ll configure network access. Since we want to make the ElasticSearch domain accessible by the outside world (that is, any browser) and not just by internal AWS services, we’ll select Public Access: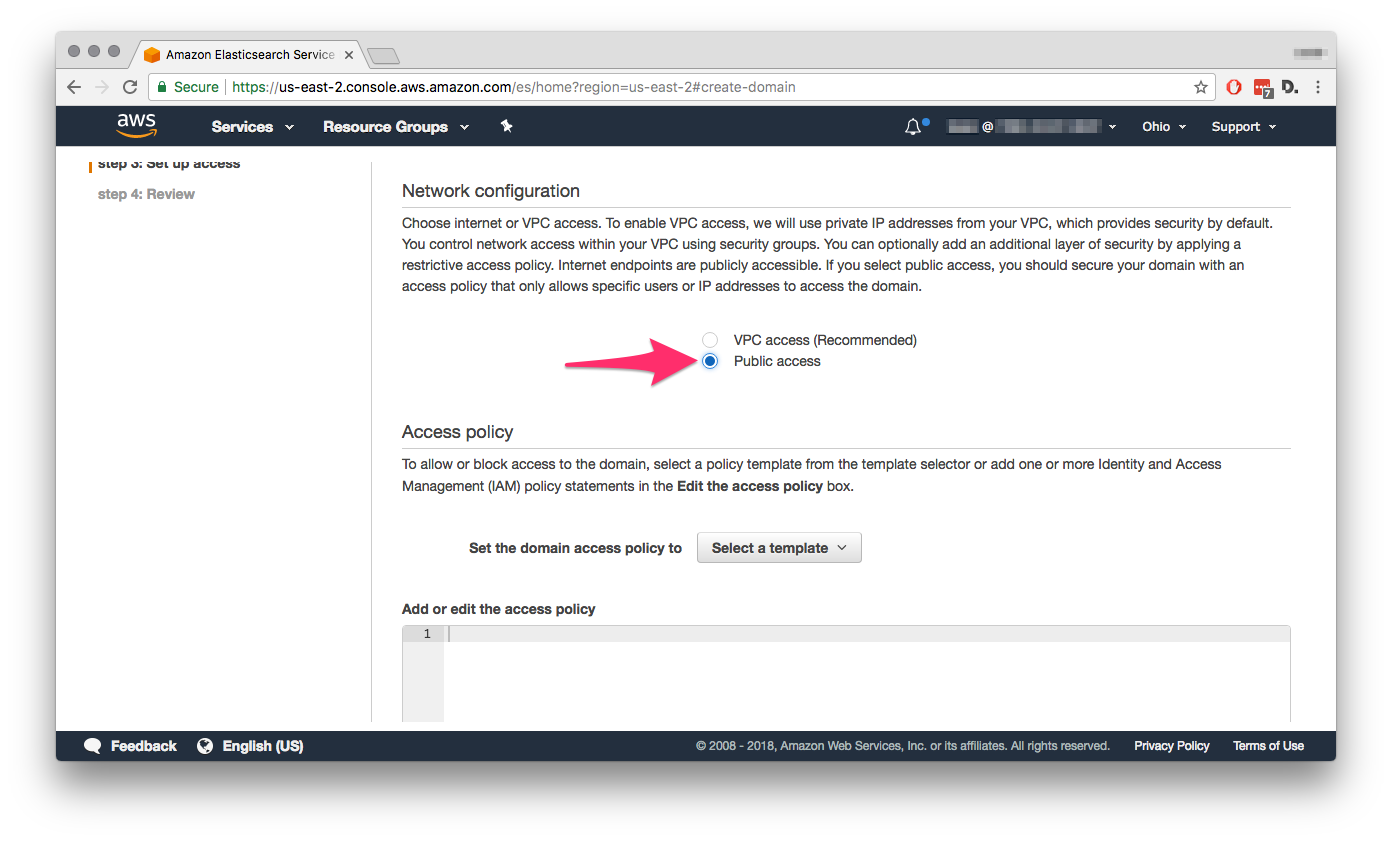
Now, we need to configure access to the domain. For our example, we’re setting the access to be fully open: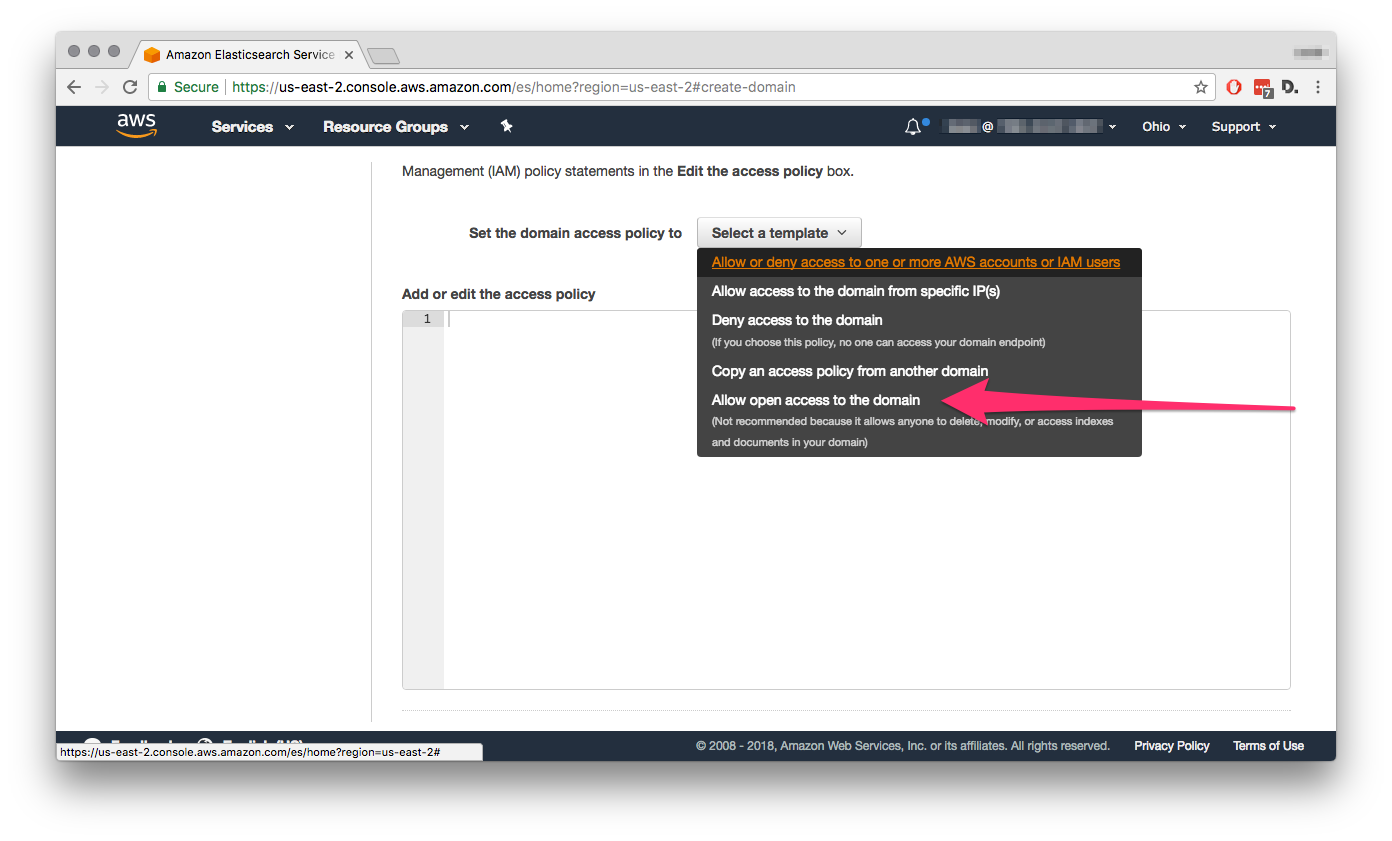
An important note: Open access to the domain is not recommended in any production environment or with sensitive data. This was done just for illustrative purposes and we encourage you to look into more secure domain access policies.
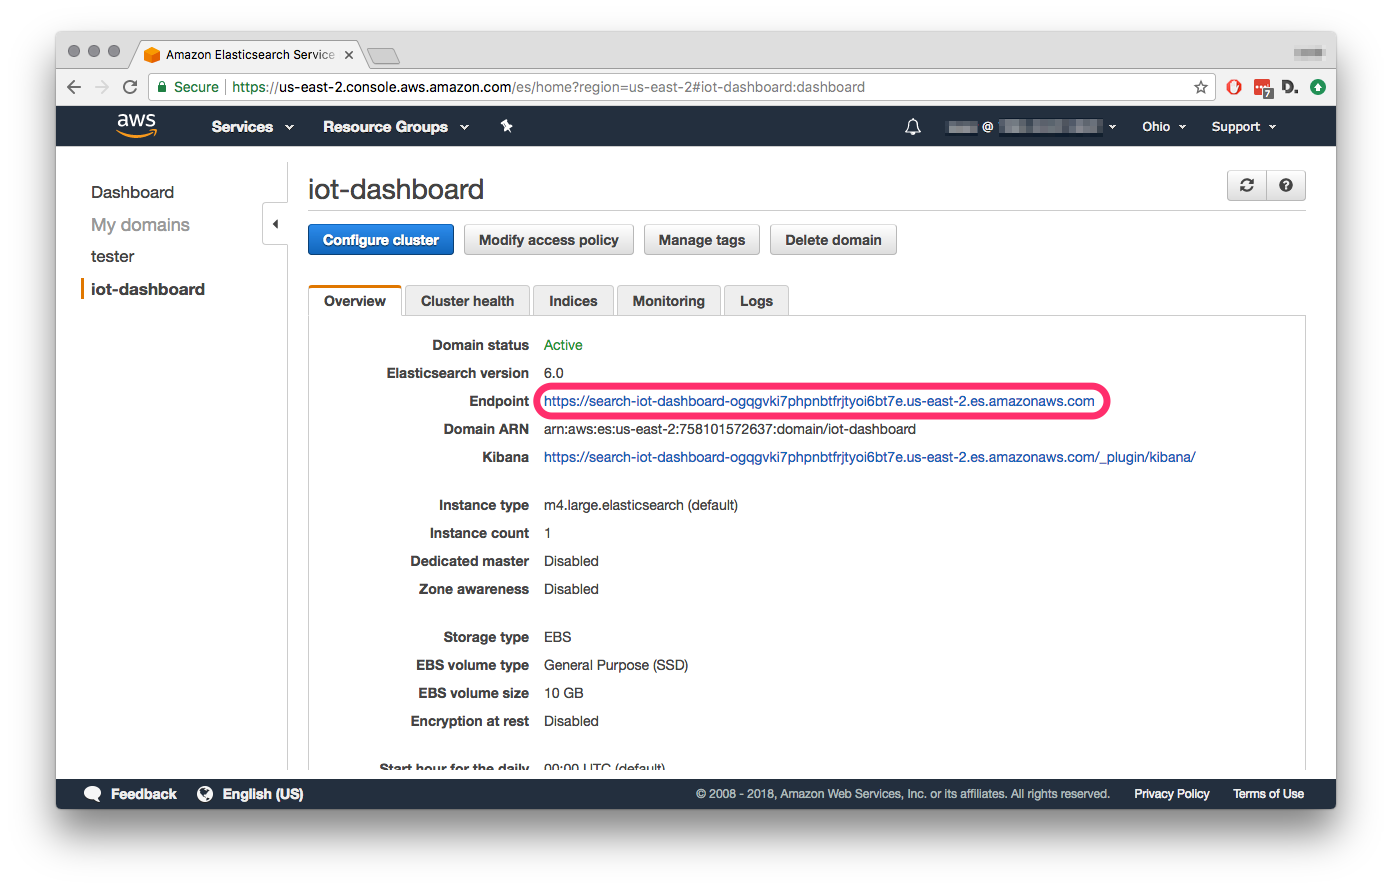
Review your configuration and hit Confirm to create the domain. It will take a few minutes for the domain to be configured and to start running. In the meantime, you can check out your newly created ElasticSearch domain, Make a note of the endpoint, we’ll be using that in a minute.
In an ElasticSearch domain, data with similar characteristic is stored (and can then be searched) under an index. A single ElasticSearch domain can have as many indexes as you want. Data points that are meant to be stored in the index are contained in a document that is expressed in JSON. Each In our case, we’ll have an index to store temperature data from our sensor, with each sensor reading in an individual document. The final piece of the puzzle is a mapping that defines how a document and its fields are stored and indexed. The mapping is usually specified when the index is created.
We can create a new index and mapping in our ElasticSearch domain with an HTTP PUT request. You can install curl on your Omega:
opkg update
opkg install curl
run the following code from your Omega, just make sure to replace the first part of the endpoint at the bottom to your ElasticSearch domain endpoint:
curl -i -H'Content-Type: application/json' -X PUT
   -d
'{
  "mappings": {
    "temperature": {
      "properties": {
        "timestamp": {
          "type": "long",
          "copy_to": "datetime"
        },
        "datetime": {
          "type": "date",
          "store": true
        },
        "temperature": {
          "type": "float"
        }
      }
    }
  }
}
'
 'https://search-iot-dashboard-ogqgvki7phpnbtfrjtyoi6bt7e.us-east-2.es.amazonaws.com/temperature'
This will create an index named temperature and setup a mapping for the date & time and the temperature reading.
Forwarding Data from AWS IoT to the ElasticSearch Domain
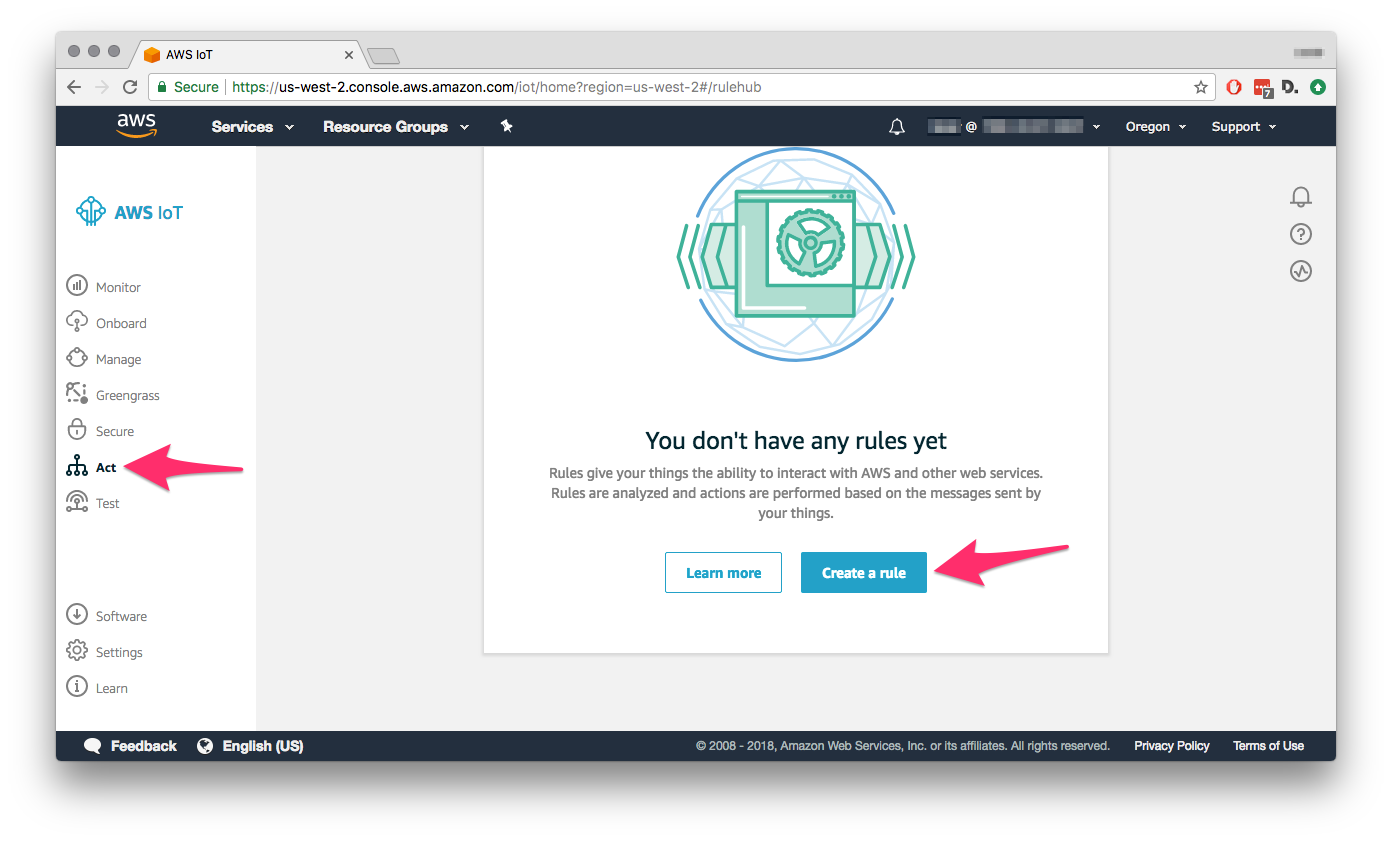
Now that the ElasticSearch domain and index are up and running, we’ll want to setup our IoT Thing to automatically populate the index with every sensor reading. To do that, we’ll make an AWS IoT rule. First navigate to the AWS IoT service, then to the Act menu, and then hit the Create a rule button:
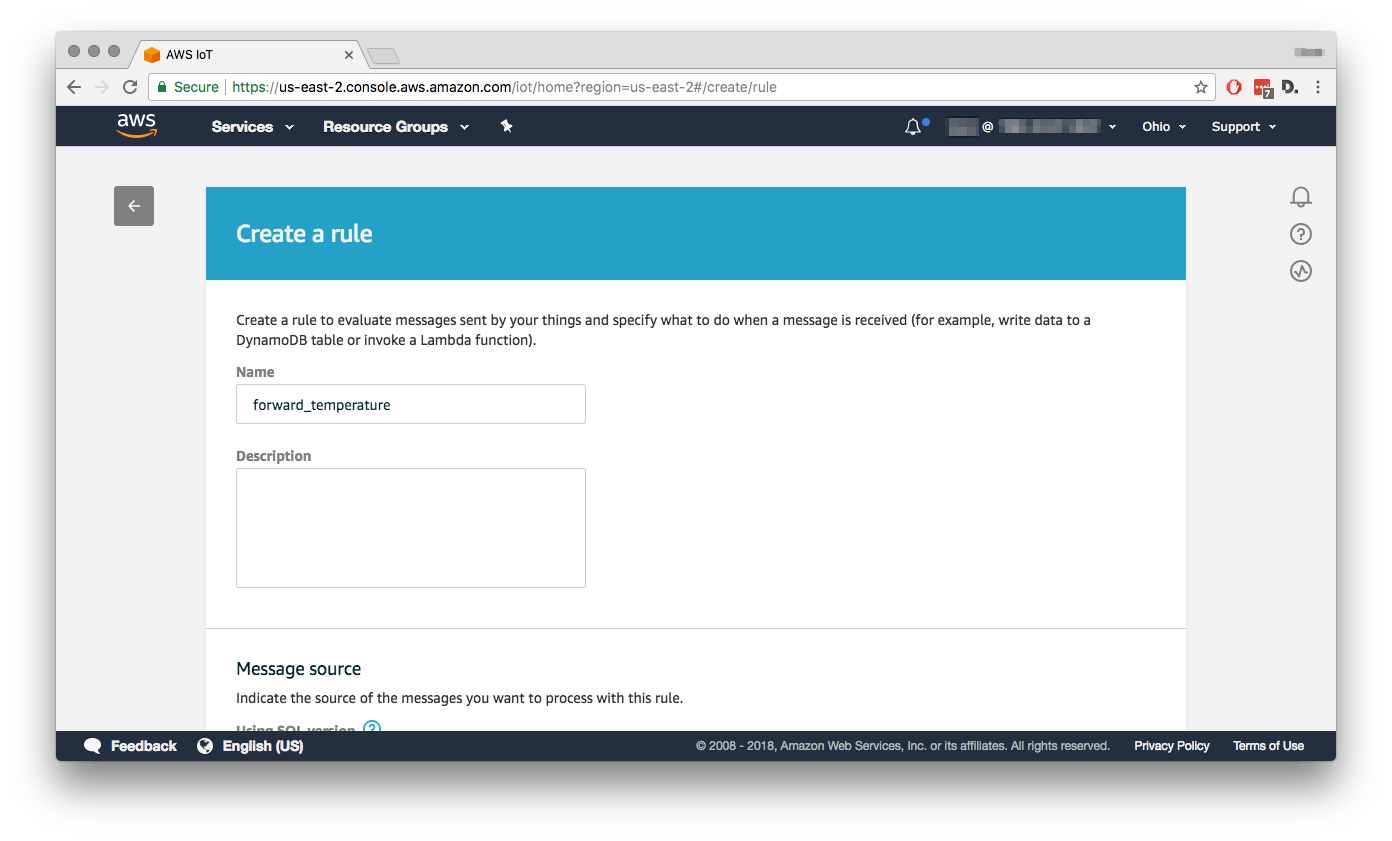
Give your rule a descriptive name:
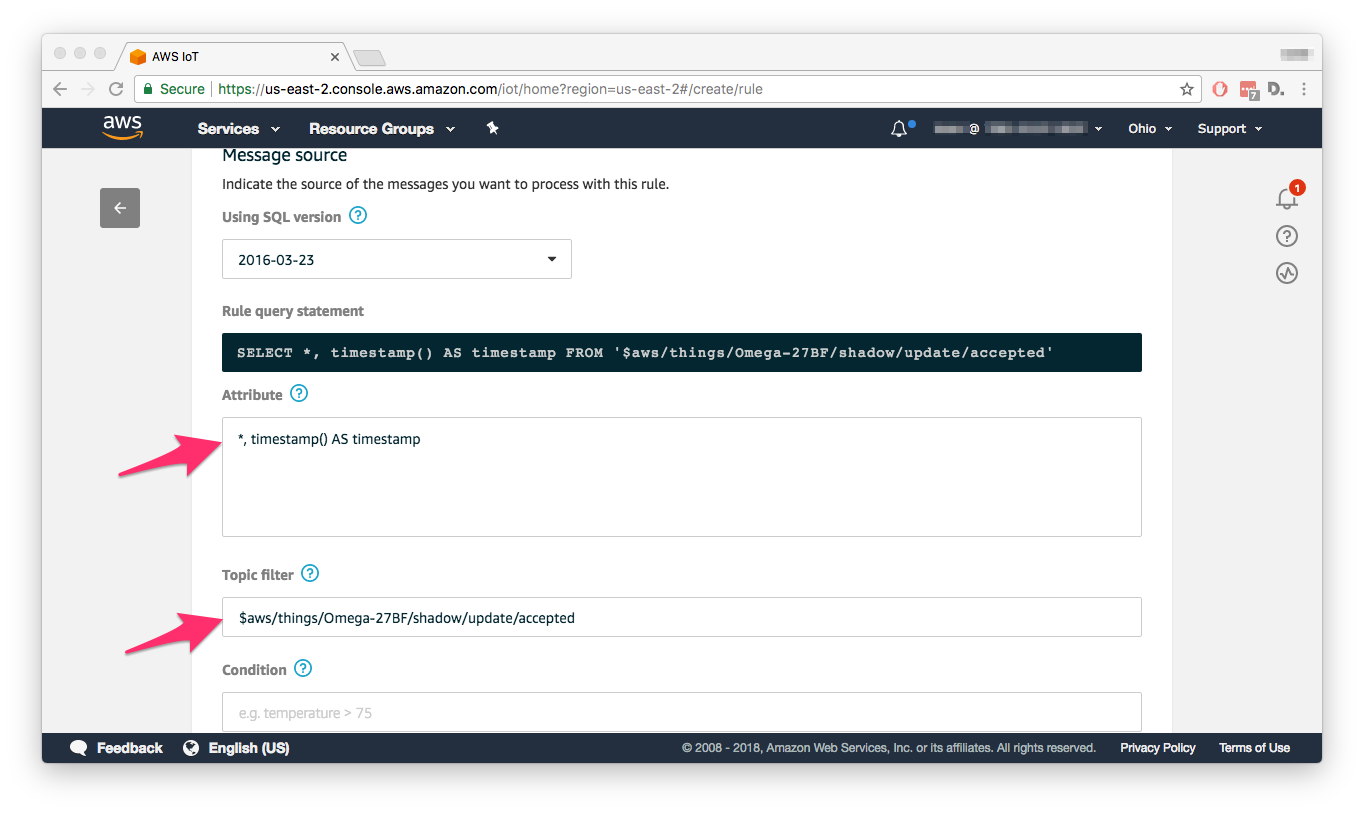
Scroll down and configure the message source. We’ll want all messages from accepted shadow updates of last week’s Omega-27BF Thing, so we set the topic filter to:
$aws/things/Omega-27BF/shadow/update/acceptedFor maximum flexibility, the rule should forward the whole shadow update and the associate timestamp, so the attribute should be set to:
*, timestamp() AS timestamp
Notice how the Rule query statement automatically updates:
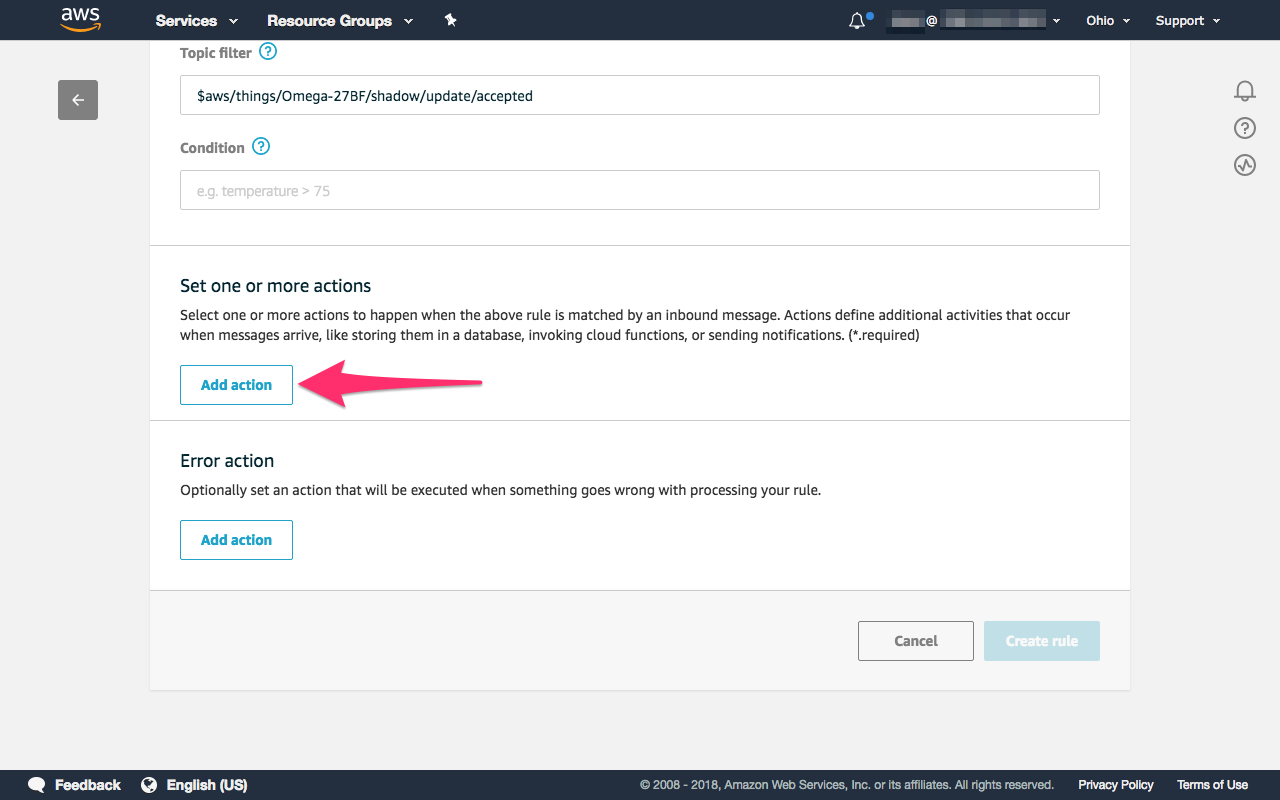
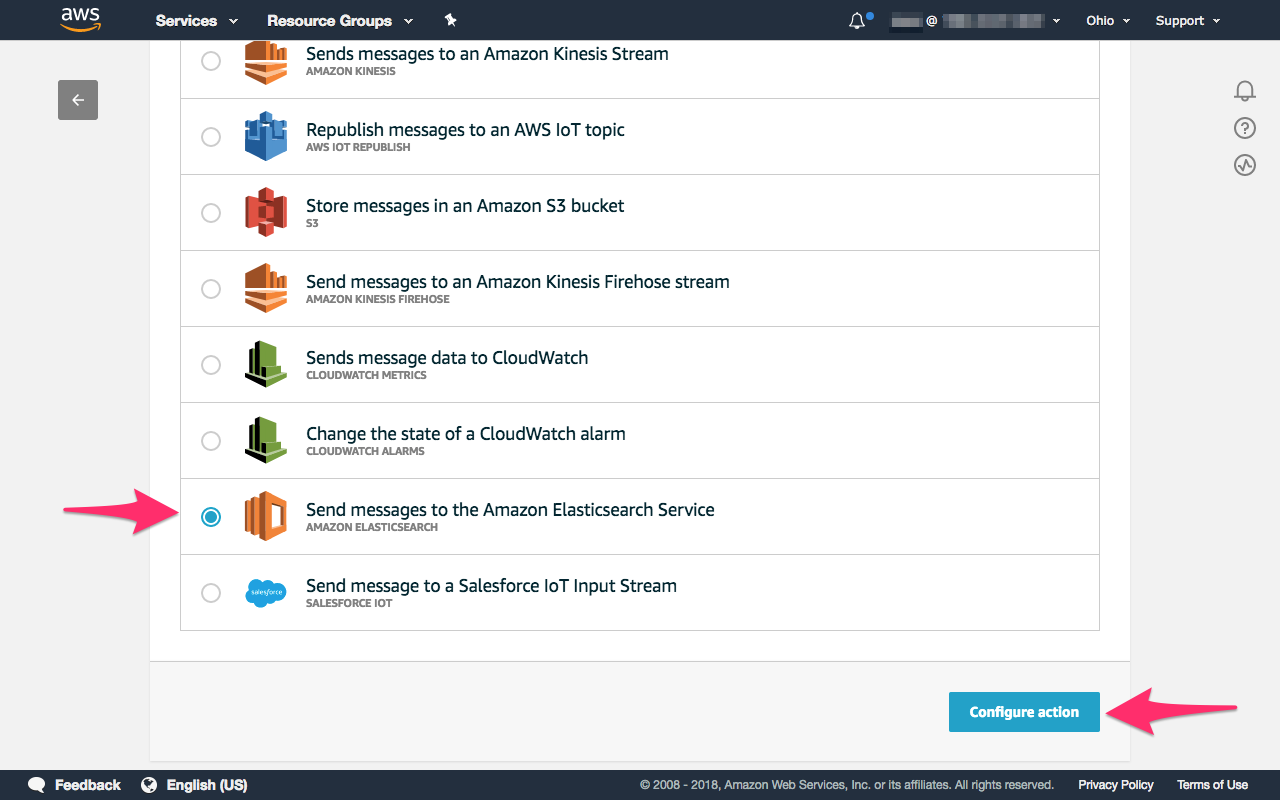
Now we’ll need to set an action for the Rule. Scroll down and hit Add action:
As the action, select Send messages to the Amazon ElasticSearch Service and hit Configure Action:
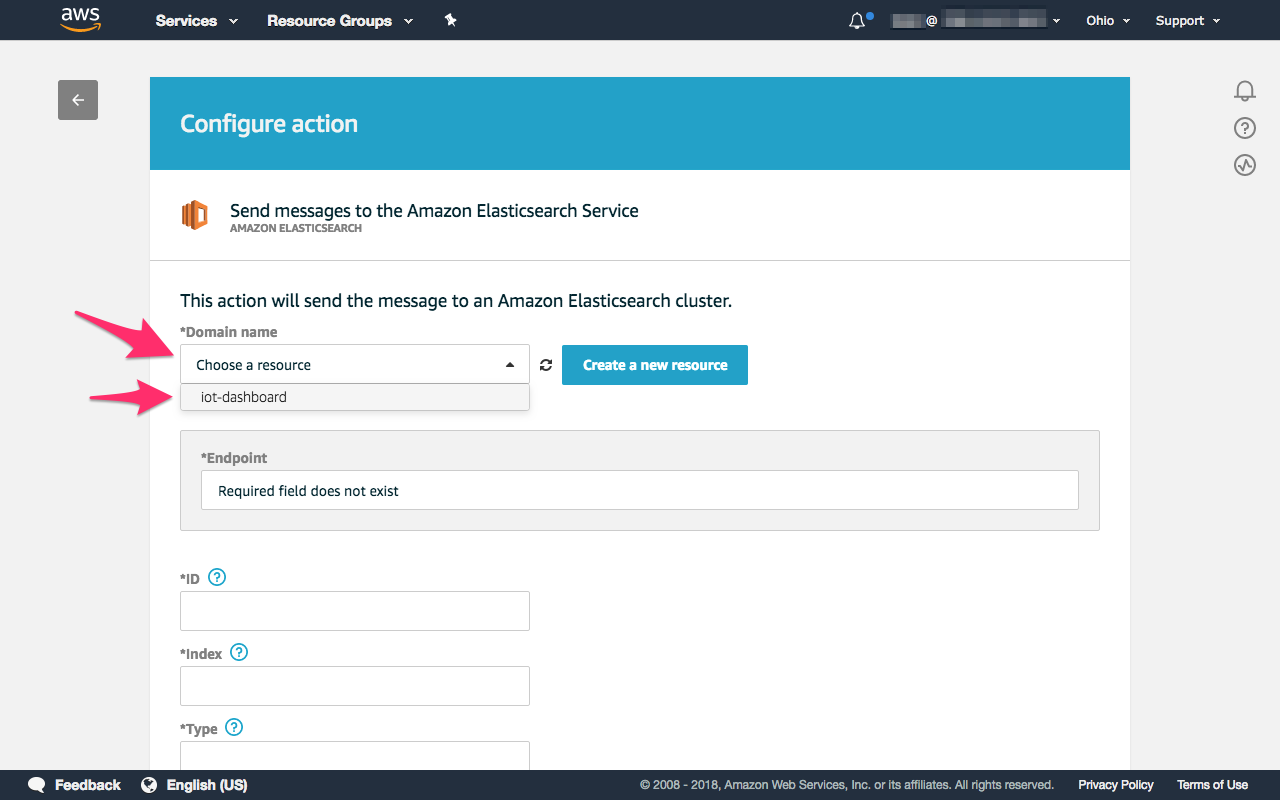
On the new page, select a Domain name from the drop-down. We’re selecting iot-dashboard, the domain we created earlier:
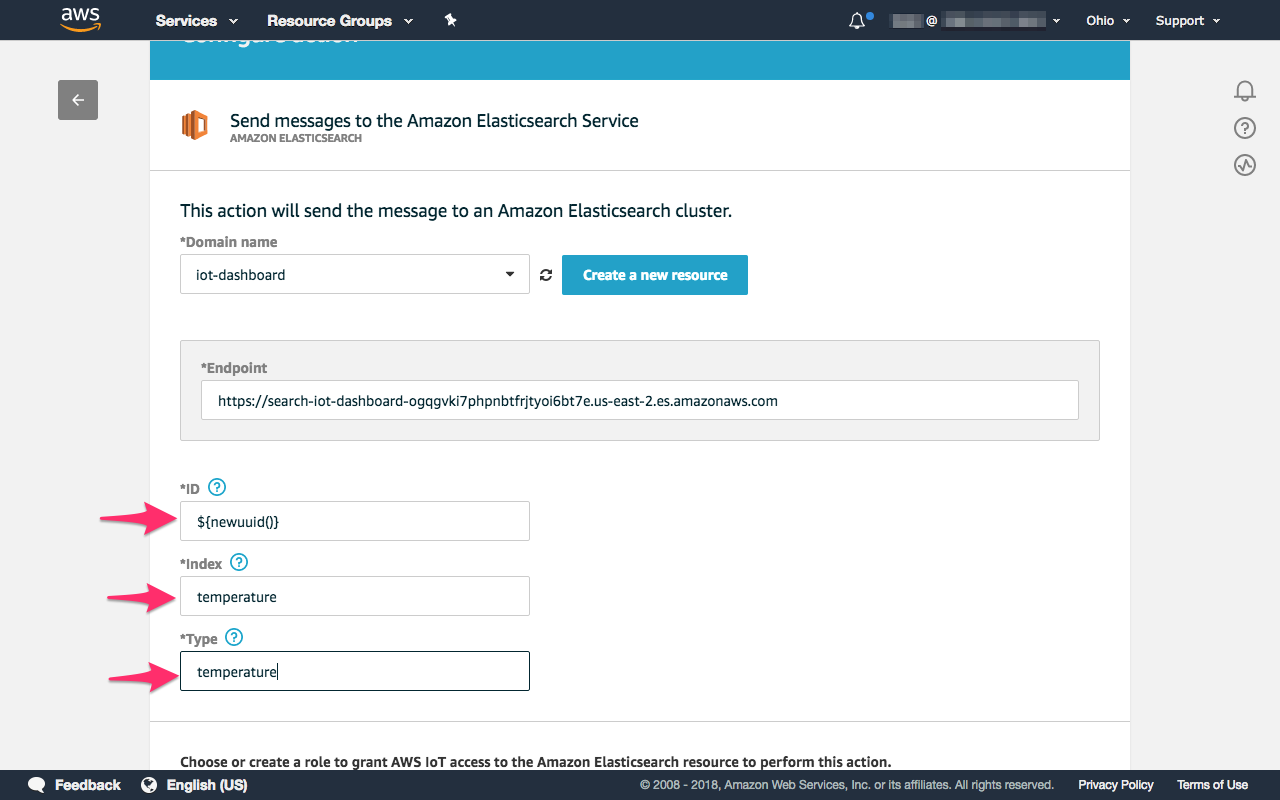
That will automatically populate the Endpoint form. The final three inputs define how each new document will be created: the document will be posted to the temperature index we created earlier, it will be of a type temperature, and each new document will be given a unique ID by generating a uuid:
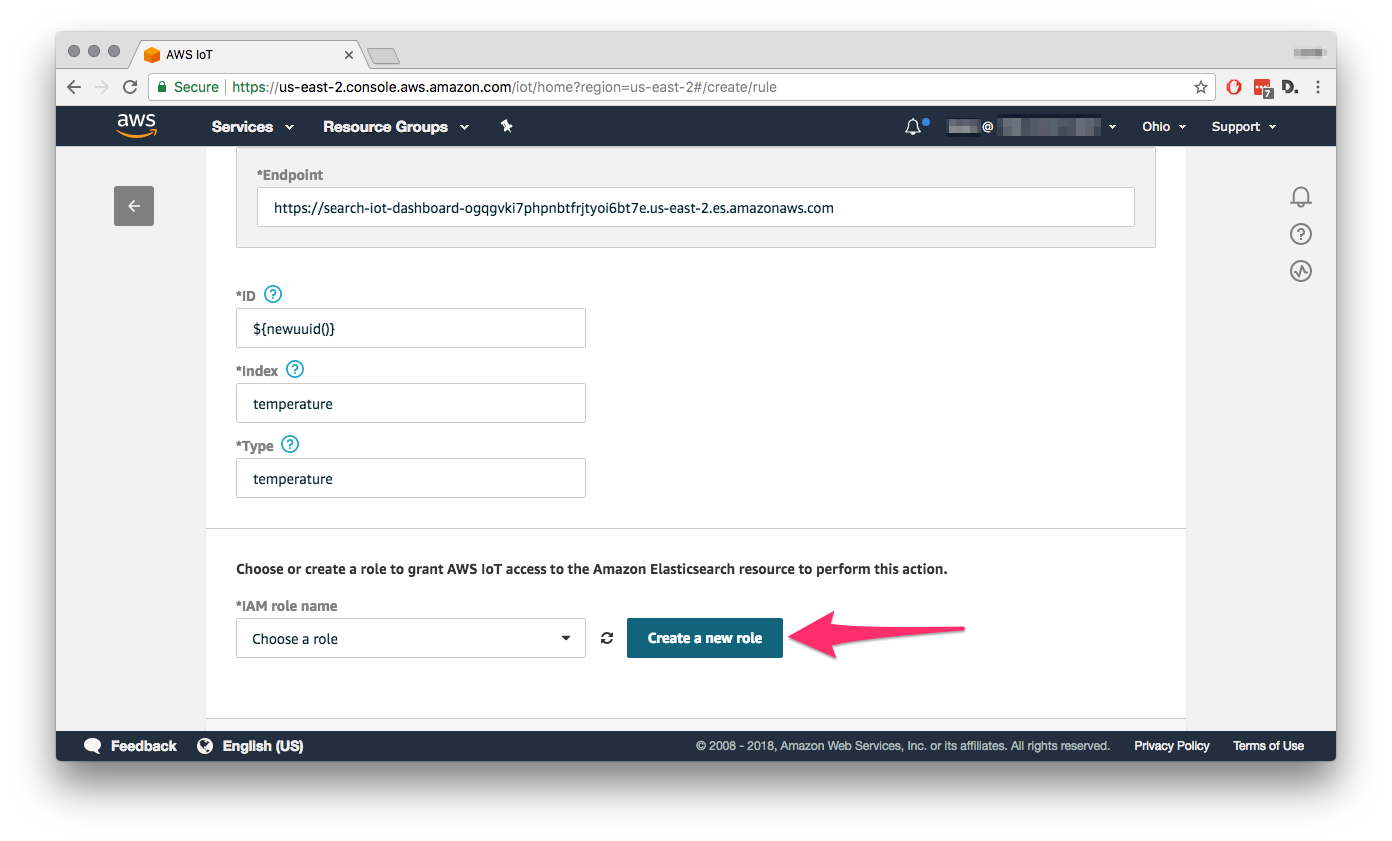
And finally, we’ll need to give AWS IoT permission to access the ElasticSearch resource. Hit Create a new role and AWS will make a new role and configure the permissions so that everything is good to go. We named our new role iot-es-access to make it descriptive:
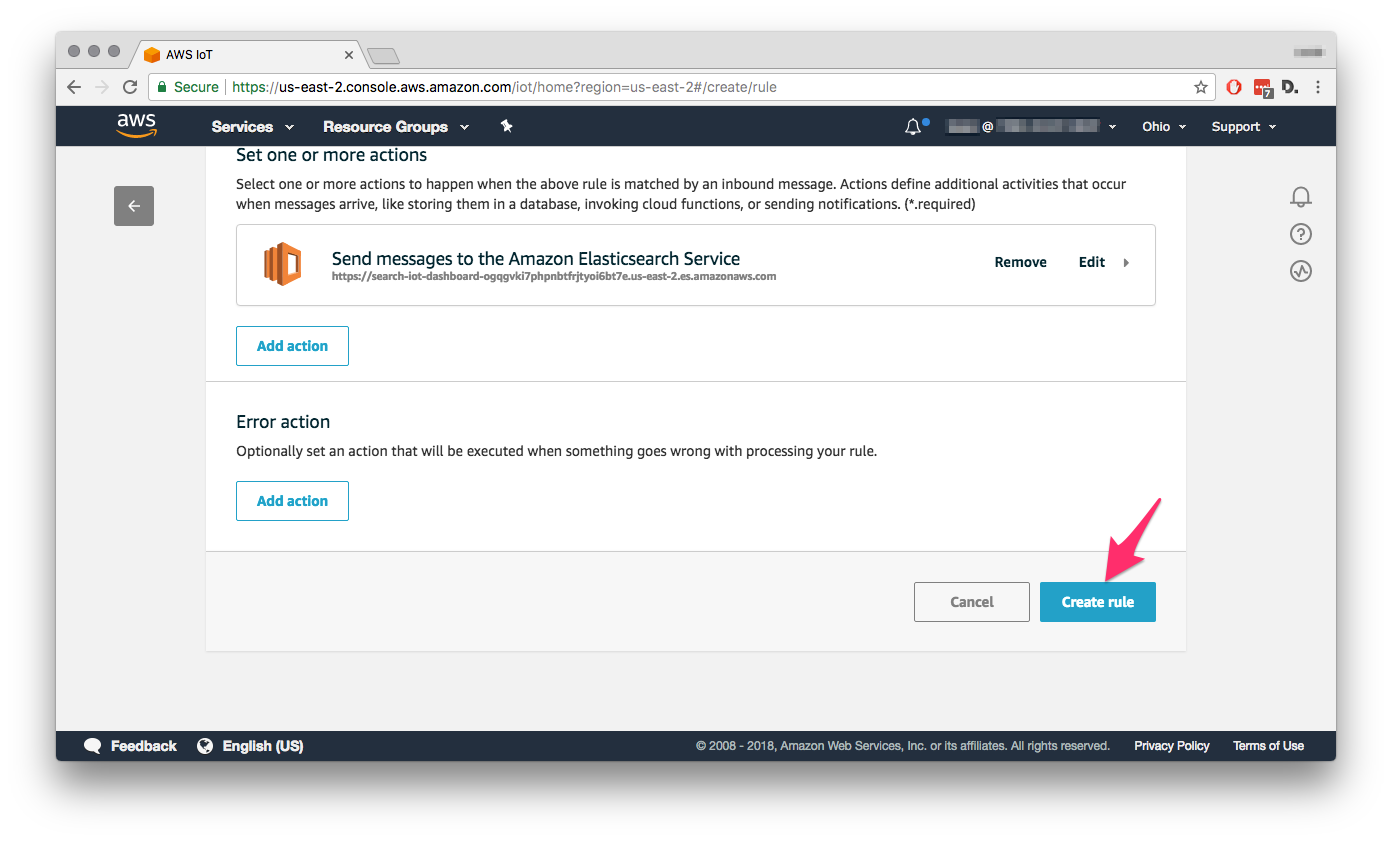
Scroll down and hit Add Action. This will take you back to the Rule page, scroll down and hit Create rule:
Your rule is now setup and all shadow updates of the Omega-27BF device will be added to the temperature ElasticSearch index. If you followed last week’s guide, this means every five minutes the reading will be transmitted to AWS IoT and then your ElasticSearch index!
To ensure the data is going through, wait about half an hour and then use your Omega to query the ElasticSearch index:
 curl -i -X GET \
  'https://search-iot-dashboard-ogqgvki7phpnbtfrjtyoi6bt7e.us-east-2.es.amazonaws.com/temperature/_search'
Again, make sure you replace the endpoint with your own ElasticSearch endpoint. The response should look something like:
{
  "took": 16,
  "timed_out": false,
  "_shards": {
    "total": 5,
    "successful": 5,
    "skipped": 0,
    "failed": 0
  },
  "hits": {
    "total": 5,
    ...
  }
}
Pay special attention to hits.total since it represents the number of datapoints stored in the ElasticSearch index.
Visualizing Data
And now, the fruit of our labors: visualizing the data we’ve been collecting. We’ll use another tool from the Elastic stack called Kibana to help us visualize the data. Kibana can be used to make really wicked dashboards, so we definitely recommend learning more about it if you’re a fan of visualizing data.
Head back to the ElasticSearch Service and click on your domain, then click on the URL labelled Kibana:
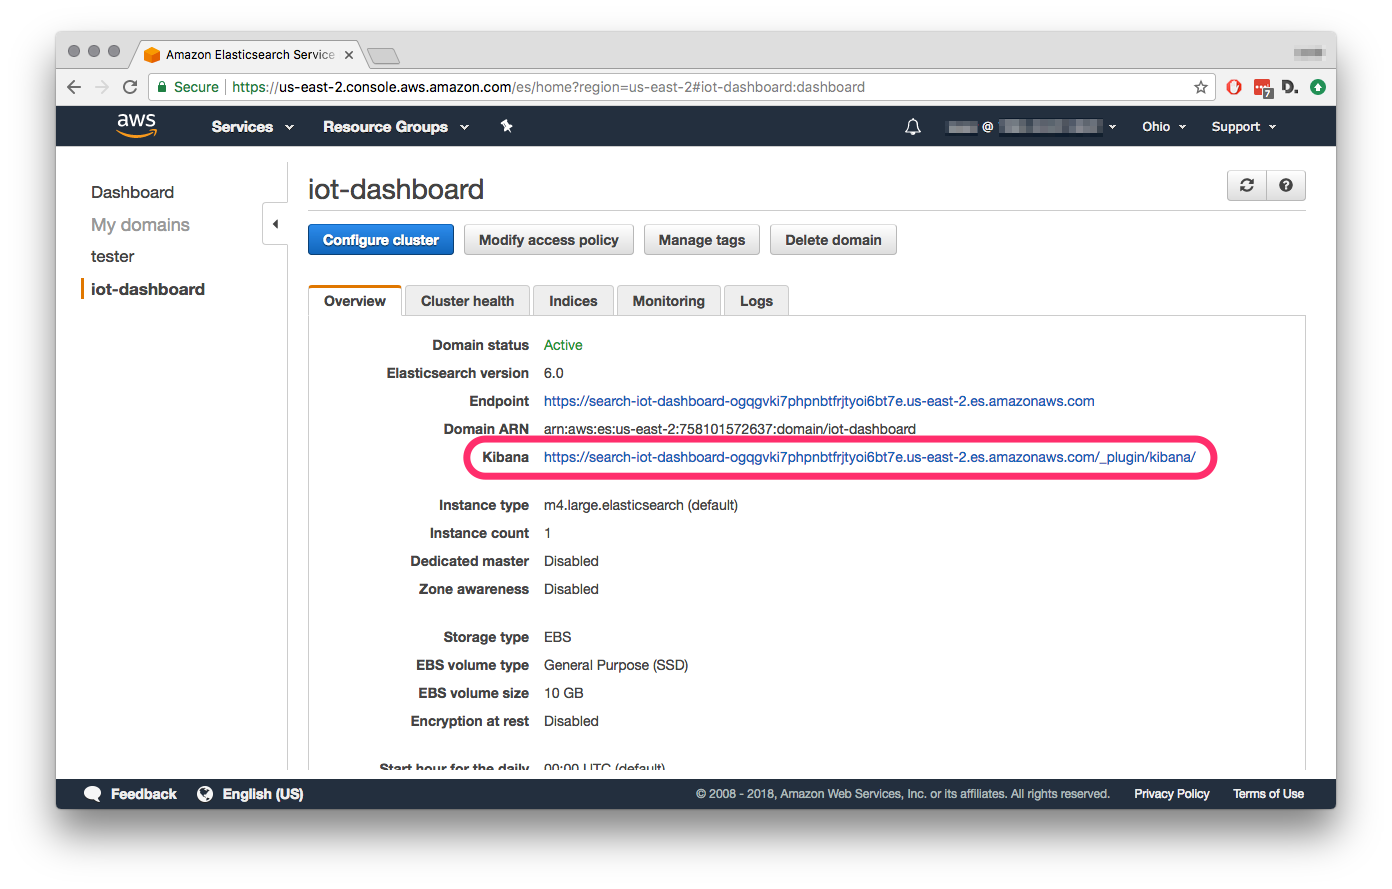
This will open the Kibana, a tool meant for visualizing and exploring ElasticSearch data, in a new browser tab:
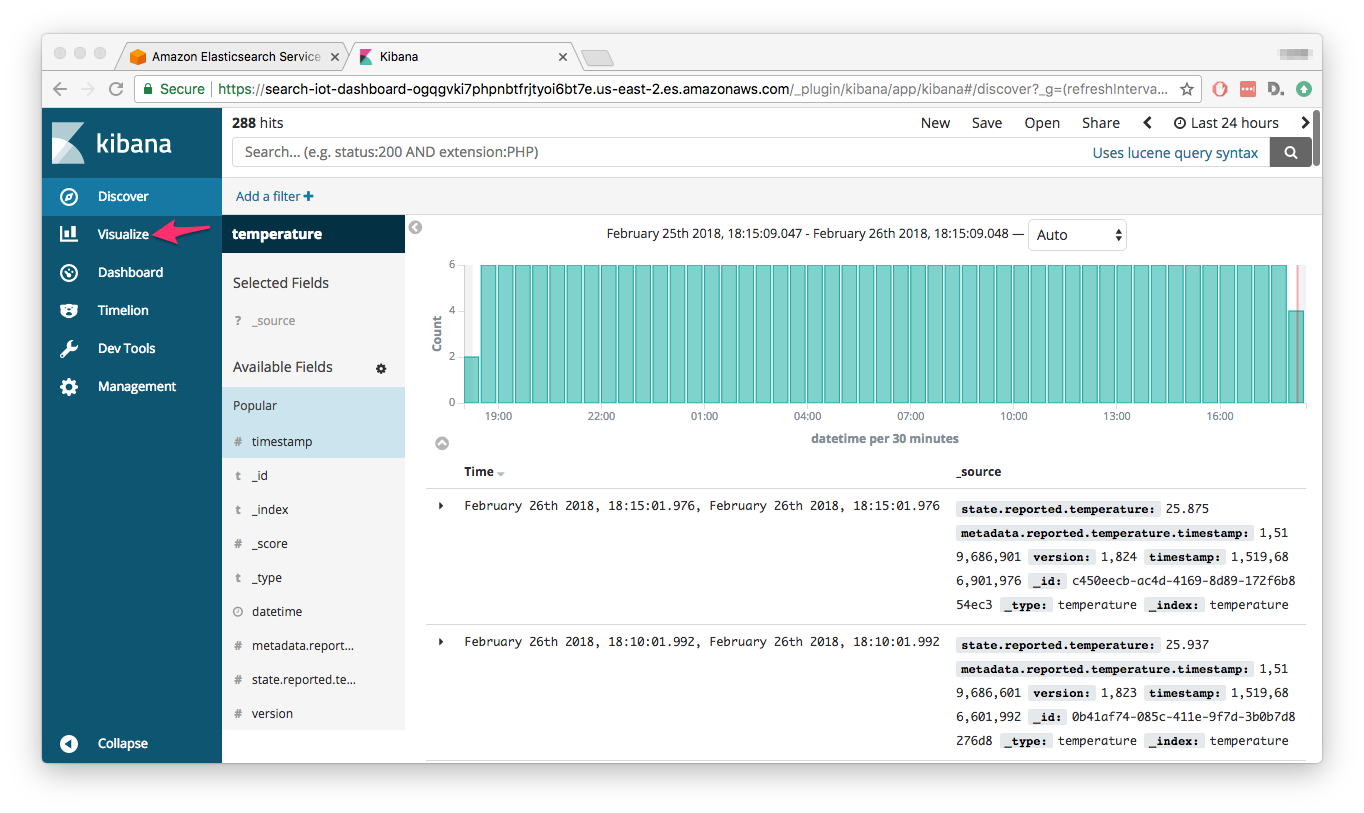
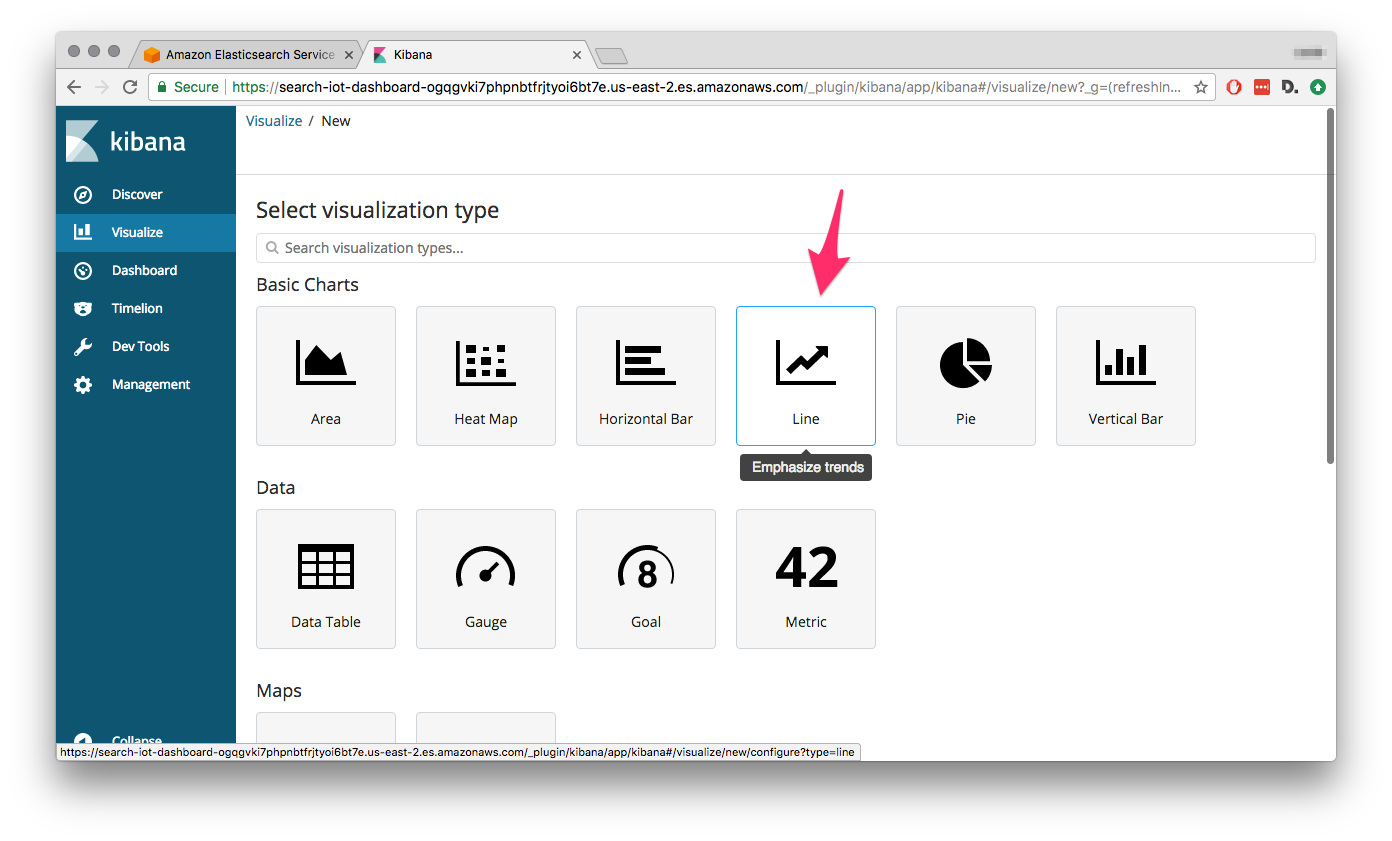
Go to the Visualize menu, and then hit the + button to Create a New Visualization. We’ll select a Line chart:
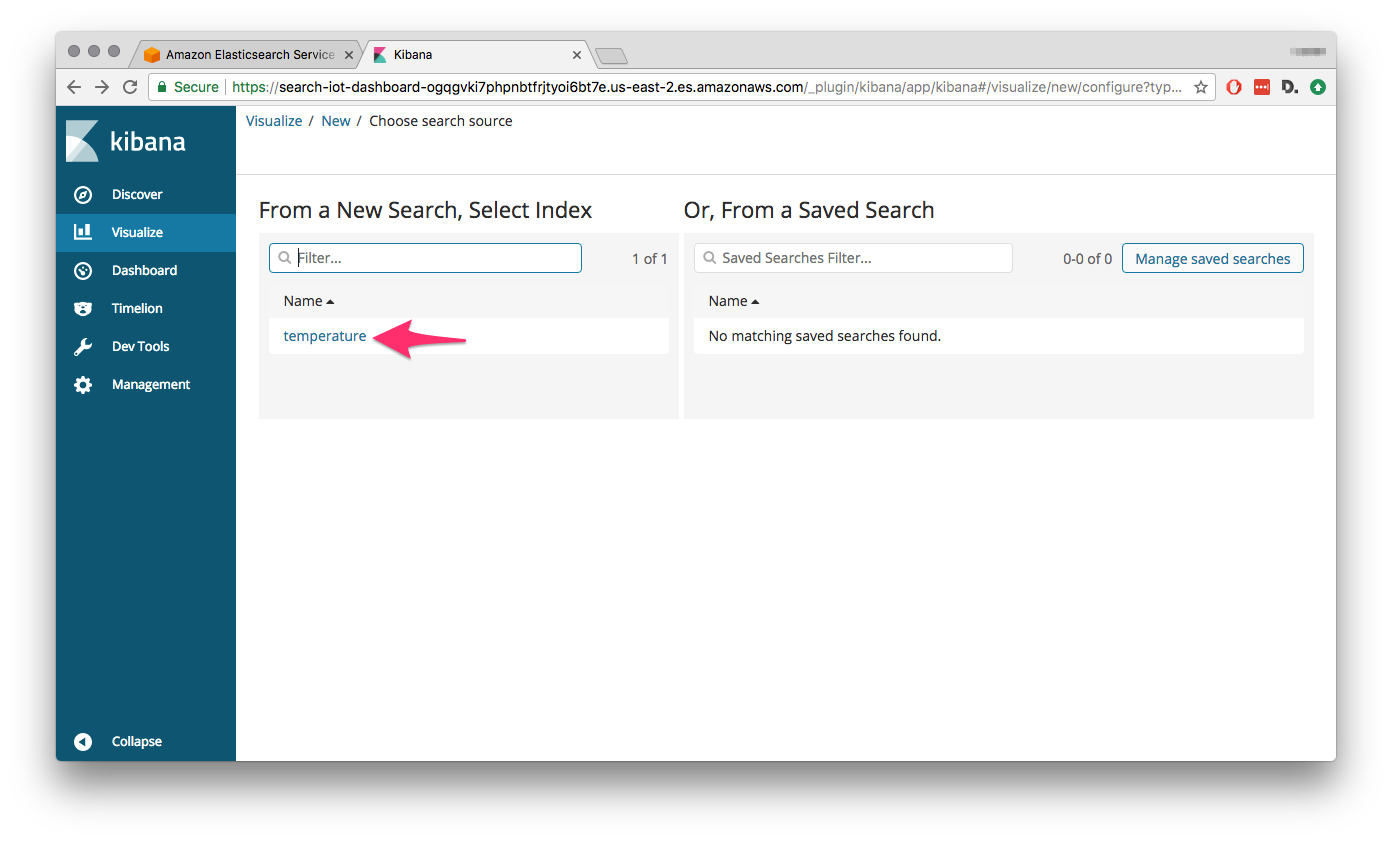
Select the temperature index:
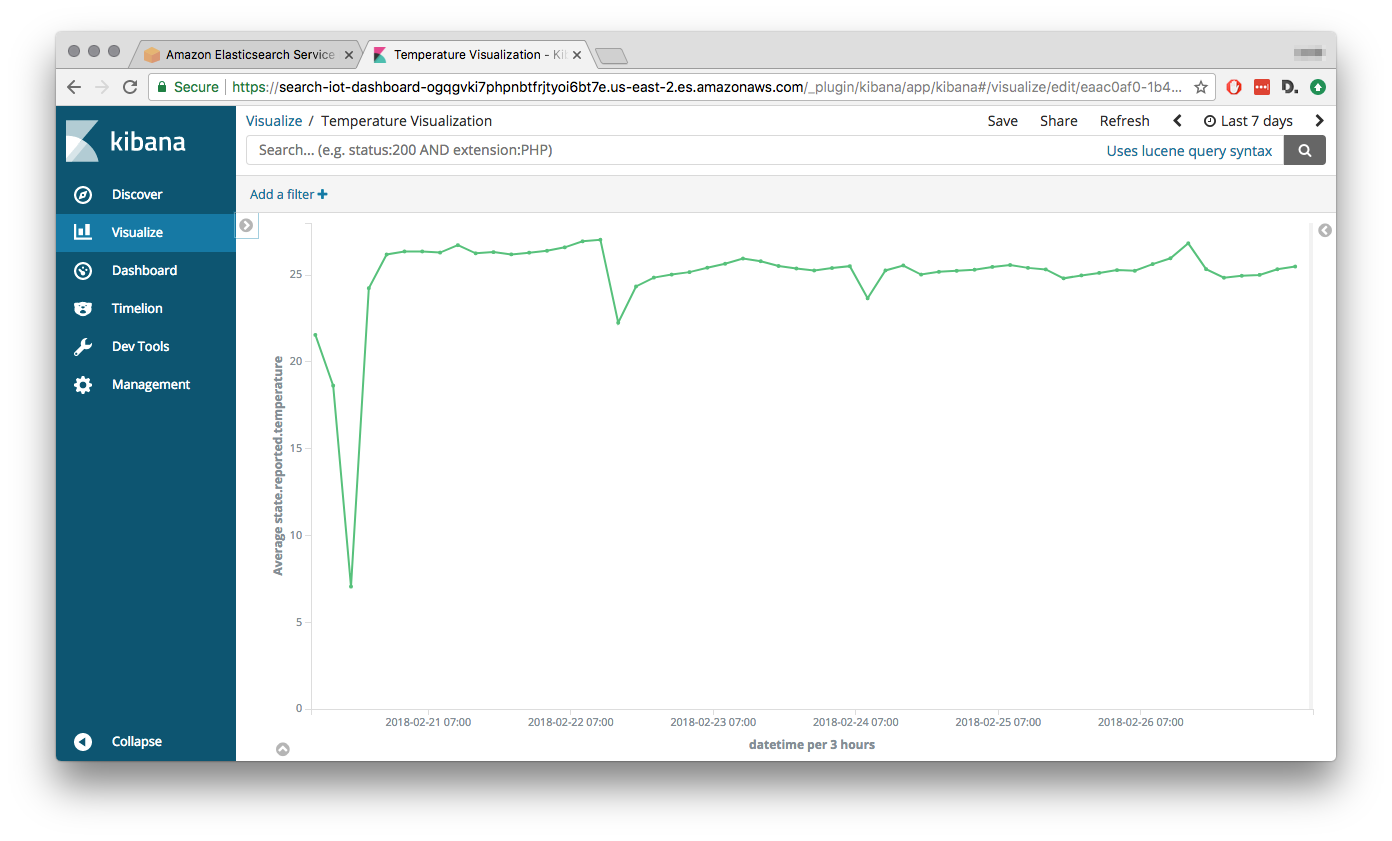
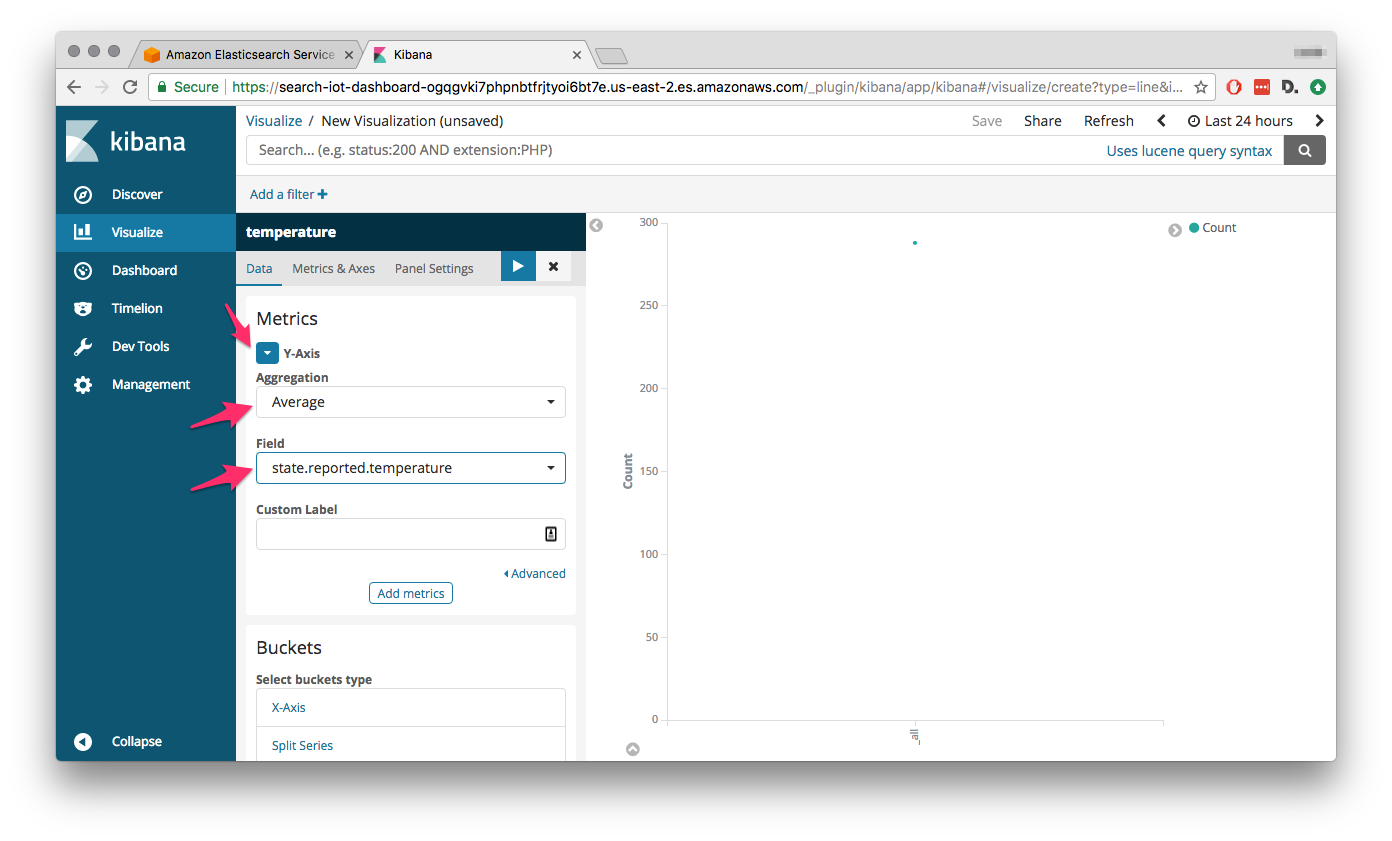
We’ll want to setup the Y-Axis to show an average of the temperature reported by the Omega. Hit the > button beside Y-Axis, then change the Aggregation to Average, and select the field to be state.reported.temperature (from our device shadow updates):
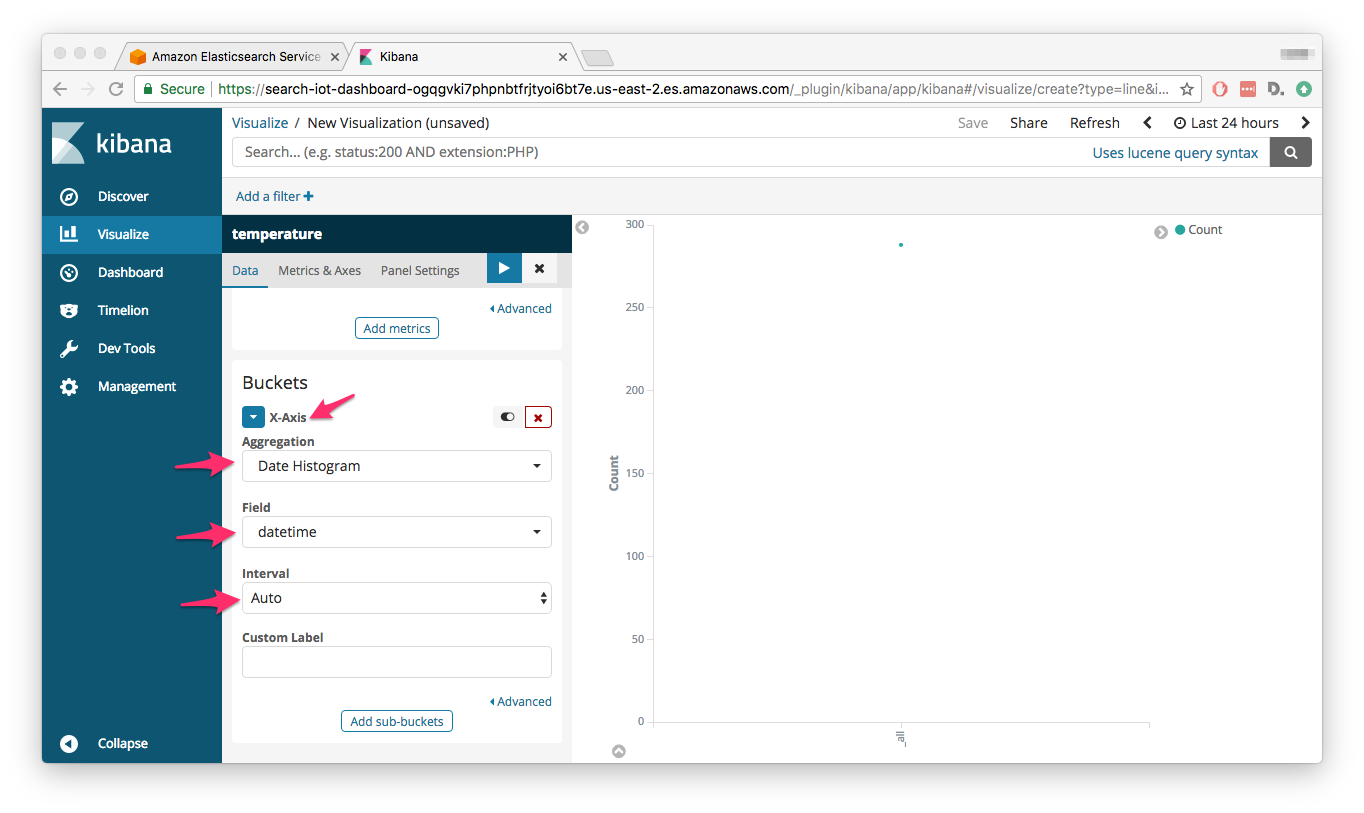
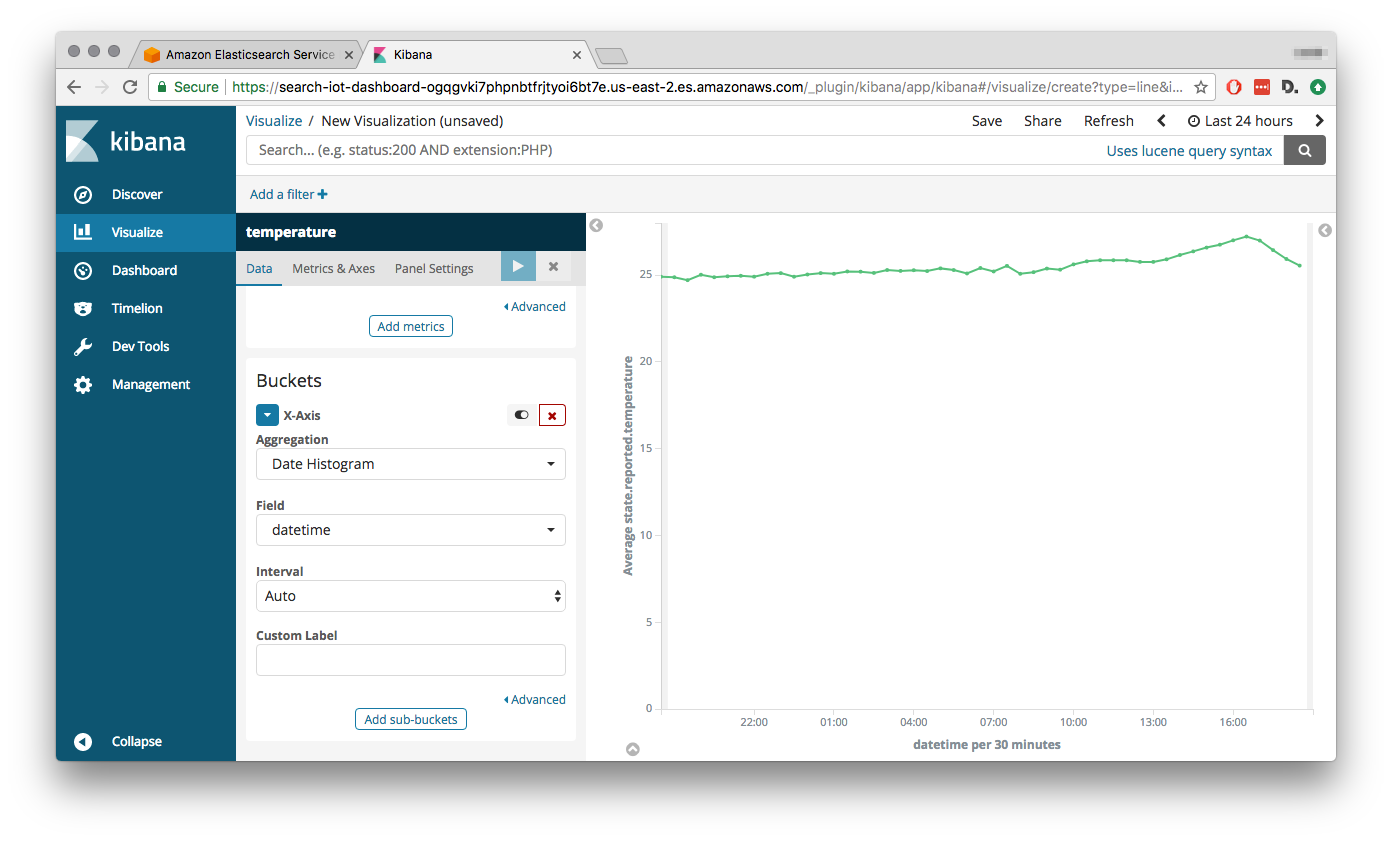
Scroll down and we’ll configure the X-Axis to show the date and time in a linear fashion. Select X-Axis as the buckets type, then Date Histogram for the Aggregation. The Field should be set to datetime and the Interval to auto:
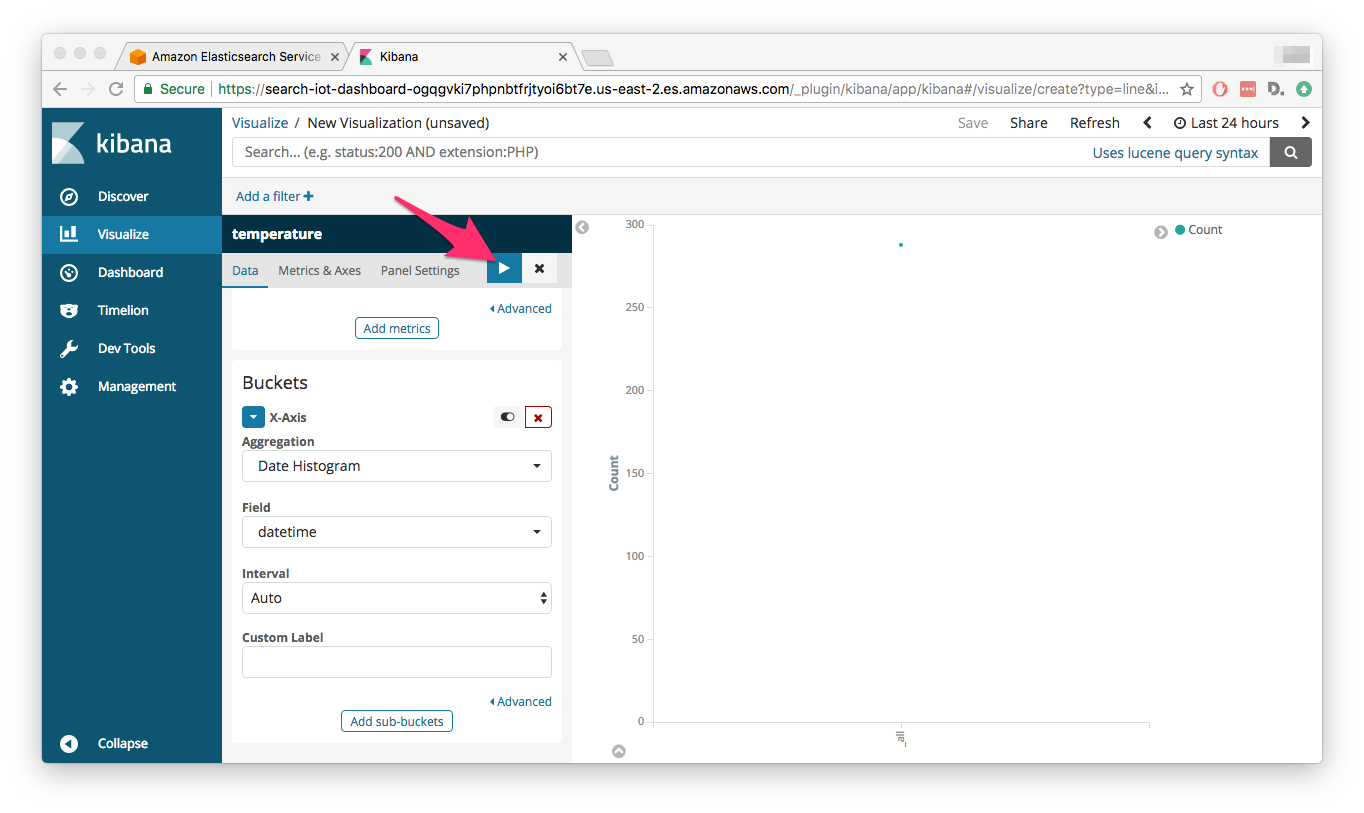
Finally, hit the large > button for the changes to take effect:
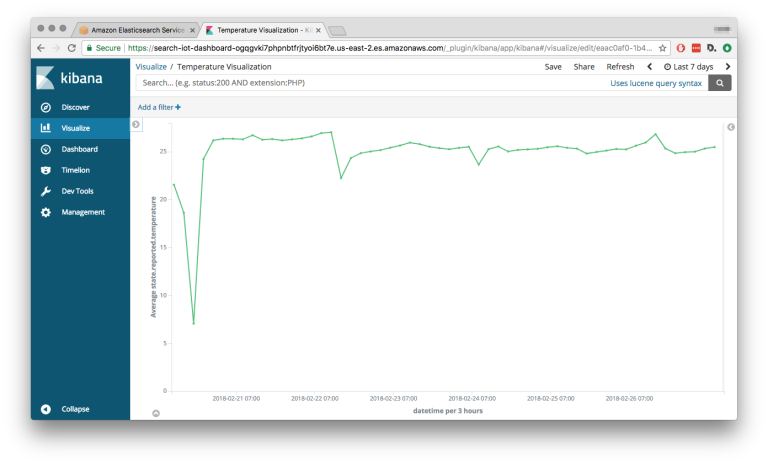
Tada, your visualization is now up:
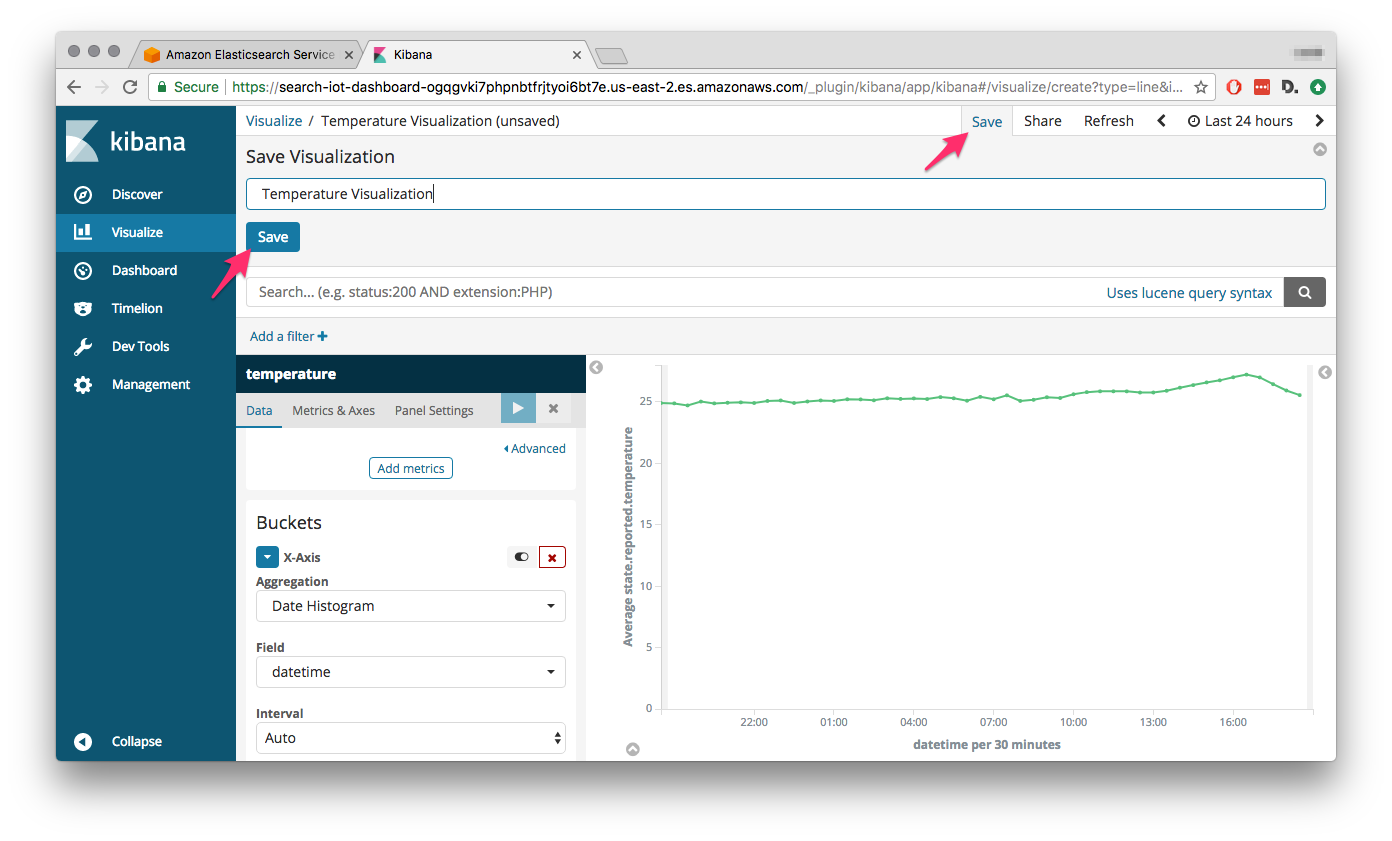
Hit the save button, give the visualization a name, and Save it:
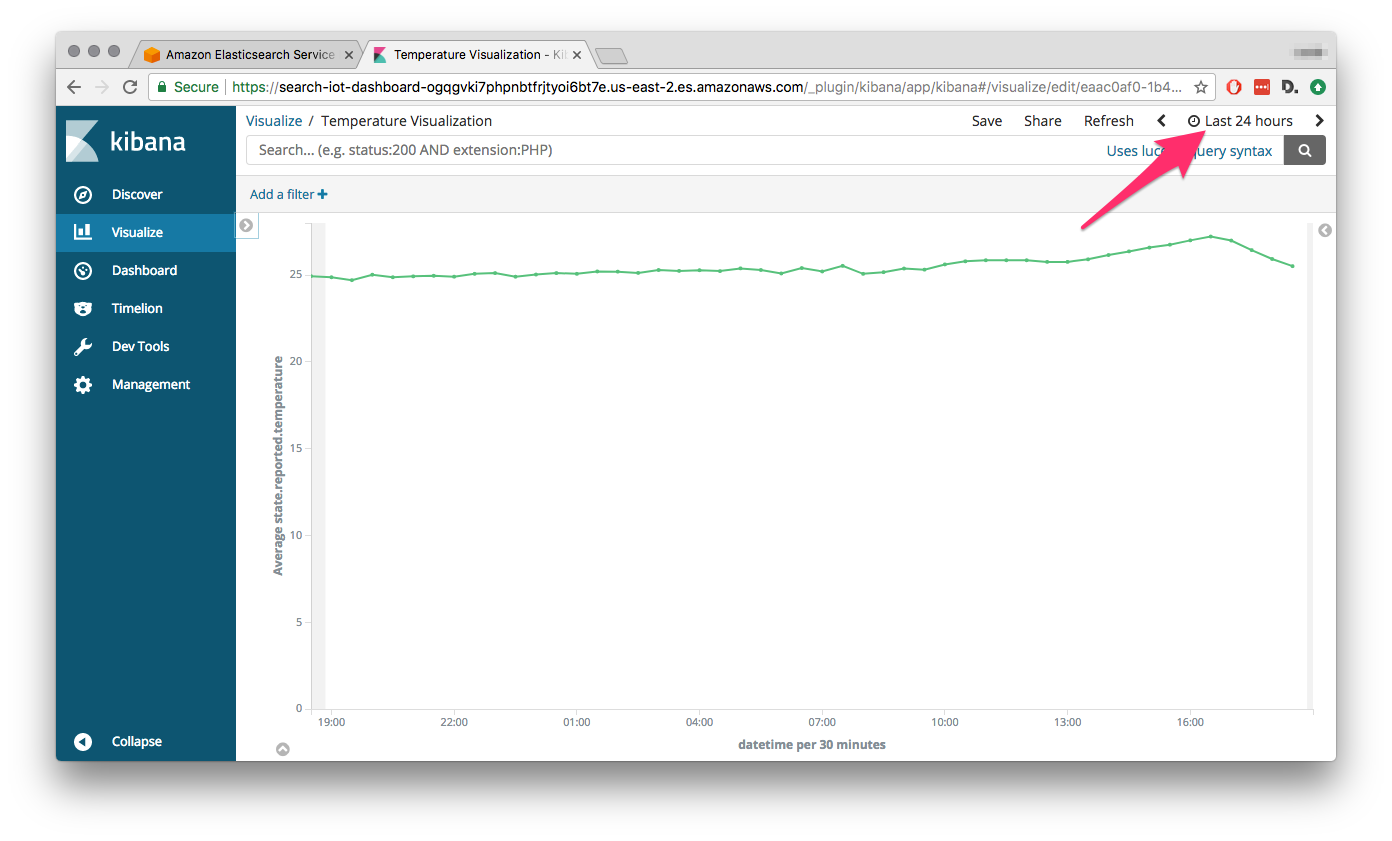
Now your temperature visualization will be always accessible from the Visualize menu. As you collect more and more data, you might want to change the Time Range of the data in your visualization:
And there you have it, an awesome, online visualization of sensor data coming from your Omega. We hope you’re inspired and can’t wait to see the dashboards and sensor use-cases you come up with, happy hacking!
To learn more about Omega2 and AWS connectivity, please follow these tutorials: